Moving-average methods need a trend. In a range they get whipsawed, and tuning the period until the past looks perfect only fits the noise. Real losing EURUSD trades show both, then you start the Yellow belt mission.
In this lesson you replay real losing moving-average trades on EURUSD: pullbacks in a range,
crossovers in a long sideways stretch and an over-fitted period. Then you start the Yellow belt
mission: five practice trades by the rules, each journaled with correct risk.
1 Moving averages need a trend
Every method in this module assumes a trend. The 200 MA filter, the EMA pullback and the
crossover all work by following price in one direction. When price goes sideways, there is
nothing to follow, and the same rules start to lose.
This lesson shows three real ways it goes wrong, then gives you the Yellow belt mission.
Every example uses real EURUSD prices. Most of these losses broke no rule. They are what
the rules cost when the market does not trend.
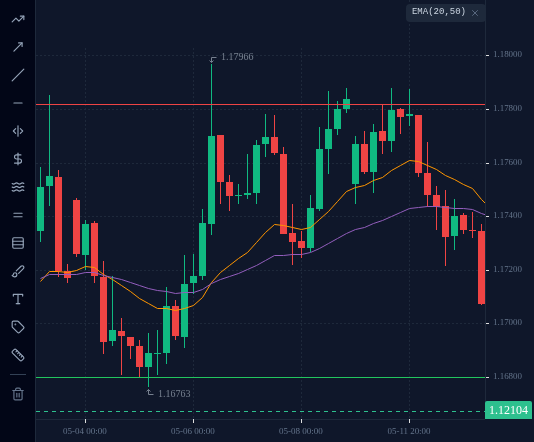
2 Failure 1: pullback trades in a range (EURUSD H4, 20 April to 13 May 2026)
This is the range from lesson 2.2: support about 1.1655 to 1.1680, resistance about 1.1782
to 1.1797. On D1, price was above the 200 MA, but the line was almost flat. Lesson 5.2’s test:
rising means at least 10 pips higher than 20 D1 candles ago, falling at least 10 pips lower,
anything in between is flat.
Two pullback buys from that range:
20 April: the slope rule was skipped. The EMA 20 was above a rising EMA 50. Price pulled
back to 1.17285, then the 00:00 UTC candle closed at 1.17599, above the previous high. But
the D1 200 MA (about 1.1672) was about 5 pips lower than 20 candles before. That is flat,
not rising, so by the rules of lesson 5.3 there was no trade. A trader who only checked “is price above the
line” took it anyway:
Entry about 1.1760, stop 1.1726 (below the pullback low), risk 34 pips, target 1.1828.
The best price was 1.17908, still 37 pips short of the target. Price was back at the top
of the range.
Stop hit on 21 April in the 16:00 UTC candle (low 1.17188). Loss: 1%.
8 May: every rule met, only just. By now the D1 200 MA was about 11 pips higher than 20
candles before. That passes the 10-pip rising test, but only by about a pip: it had passed
for the first time two days earlier. Price pulled back to 1.17217, then the 04:00 UTC
candle closed at 1.17429, above the previous high. That was the first trigger after the
pullback. The EMA 20 was above the EMA 50, but only
about 9 pips above it.
Entry about 1.1743, stop 1.1720, risk 23 pips, target 1.1789.
Price reached 1.17877 on 8 May and again on 11 May, about 1 pip short of the target both
times.
Stop hit on 13 May in the 04:00 UTC candle (low 1.17069). Loss: 1%.
The second trade was not a mistake: the rules were followed and it lost. But the warning
signs were the same both times: a 200 MA barely moving, EMAs close together, and resistance
a few dozen pips above the entry. When the rules are only just met, the trend is weak.
EURUSD H4 chart up to 13 May 2026, 04:00 UTC with EMA 20 and EMA 50 and 2 lines drawn, as described in "Failure 1: pullback trades in a range (EURUSD H4, 20 April to 13 May 2026)".
Open this in the terminal
↗(opens in a new tab)
Quick check
3 Failure 2: crossovers in a long sideways stretch
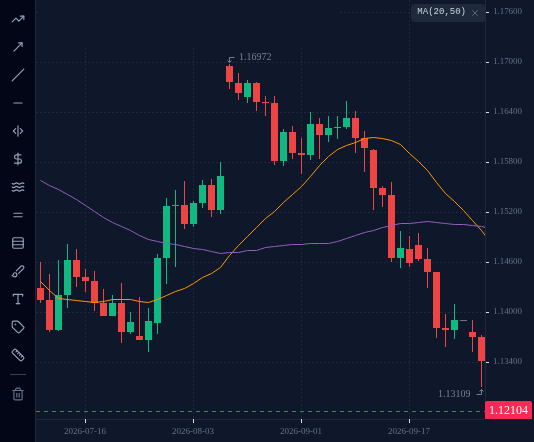
Lesson 5.4 showed three MA 20 / MA 50 crosses losing in autumn 2025. The run did not stop
there. On EURUSD D1, every cross from 18 August 2025 to 29 September 2026 was followed by a
loss when the next cross closed it:
Cross
Trade
Result
18 Aug 2025
sell 1.16602
−102.7 pips
8 Sep 2025
buy 1.17629
−76.2 pips
16 Oct 2025
sell 1.16867
−50.9 pips
11 Dec 2025
buy 1.17376
−101.7 pips
9 Mar 2026
sell 1.16359
−107.3 pips
21 Apr 2026
buy 1.17432
−146.0 pips
3 Jun 2026
sell 1.15972
−66.1 pips
24 Aug 2026
buy 1.16633
−321.3 pips
Eight losses in a row, 972.2 pips in total, before costs. The one trend trade before
them (February to August 2025) made 1,197.6 pips. A method like this can give back most of a
big win while you wait for the next trend, and losing streaks are part of it. That is why
every trade is sized at 1%.
4 Failure 3: tuning the period until the past looks perfect
After a losing run it is tempting to look for “better” settings. Test enough of them on old
data and one will always look great. That is over-fitting: the settings fit the noise in
that stretch of history, not anything that repeats.
A real test on EURUSD D1 crossovers: 174 different pairs of periods, from MA 5 to MA 200,
on the trading days of 2025.
The best pair on 2025 was MA 5 / MA 70: +1,133.9 pips.
The same pair from 1 January to the 14 October 2026 close: −264.5 pips, with 7 of its
9 trades losing.
The plain MA 20 / MA 50 had a losing 2026 too. No period fixes a market that is not
trending. Pick standard settings (20, 50, 200), keep them, and judge them over many trades,
not one good year.
Quick check
5 Your Yellow belt mission
To finish Module 5, complete this mission on your practice account:
Take 5 practice trades by the EMA pullback rules, each journaled with correct risk.
For each trade, write down in your journal (a notebook or a spreadsheet is fine):
The date, the pair and the timeframe (H4).
The 200 MA on D1: above or below, and how many pips it moved over the last 20 candles.
Less than 10 pips either way is flat, and flat means no trade.
The pullback low (or high, for a sell) and the trigger candle.
Entry, stop-loss and take-profit at twice the risk.
The lot size, the money at risk and the percent of the account. Correct risk means at most
1%, with the lot size rounded down.
The result, and whether you followed every rule.
Losing trades count, as long as they followed the rules. A trade that broke a rule does not
count, even if it won.