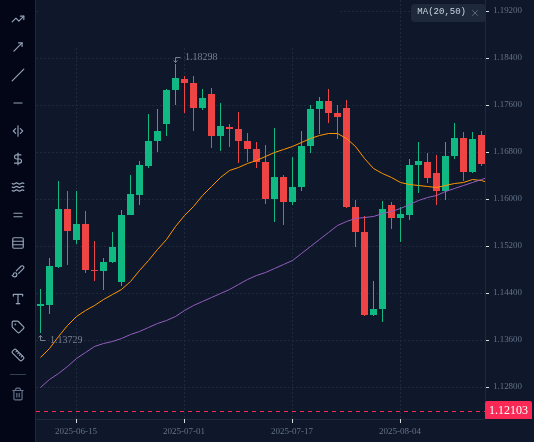
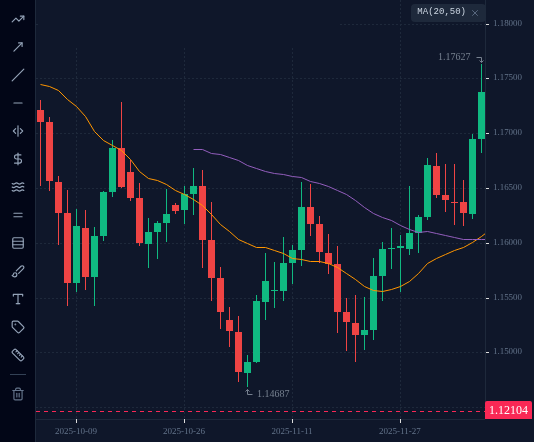
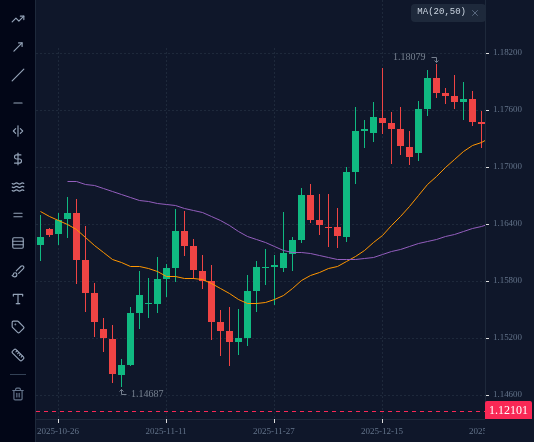
When a faster moving average crosses a slower one, the average direction of price has changed. The MA 20 / MA 50 cross catches big trends, but always late, and in a sideways market it loses again and again.
In this lesson you see what a moving-average crossover is, measure how late it is on real EURUSD
turns, and test it on a trending year and a sideways autumn.
1 What a crossover is
Put two moving averages on the same chart, a fast one and a slow one. Here: MA 20 and
MA 50, both simple averages, on D1.
When MA 20 crosses above MA 50, the last 20 days have averaged higher than the last
50. Prices have been rising.
When MA 20 crosses below MA 50, the last 20 days have averaged lower. Prices have been
falling.
Some traders use the cross itself as the signal: buy on a cross up, sell on a cross down,
and hold until the next cross. This lesson tests that idea on real EURUSD data.
2 Why the cross is always late
Both lines lag (lesson 5.1), and the cross has to wait for both. So it can only arrive well
after the turn.
The bottom. EURUSD made its low of 1.01772 on 13 January 2025. MA 20 crossed above
MA 50 on 13 February, with the close at 1.04626. That is a month later and
1.04626 − 1.01772 = 0.02854 = 285 pips above the low.
The top. EURUSD made its high of 1.18298 on 1 July 2025. MA 20 crossed below MA 50 on
18 August, with the close at 1.16602, about 170 pips below the high.
A cross never catches the turning point. It confirms a turn after a good part of the move
has already happened.
Quick check
Question 1 · Click the chart
On the EURUSD D1 chart with MA 20 and MA 50, click the point in August 2025 where MA 20 crossed below MA 50.
EURUSD, D1, up to 2025-08-18 (UTC).
Tap or click the chart to pick a spot, then press Check. Keyboard: focus the chart, then arrow keys move the crosshair (Shift for bigger price steps), Enter picks.
Loading chart…
3 When it helps: a long trend
In a long trend, being late does not matter much. Buy at the 13 February 2025 cross
(1.04626) and sell at the next cross, 18 August 2025 (1.16602):
1.16602 − 1.04626 = 0.11976 = 1,197.6 pips, missing about 285 pips at the start and
about 170 at the end.
USDJPY, same rules: MA 20 crossed above MA 50 on 18 June 2025 (close 145.099) and back below
on 12 September 2025 (close 147.645). That trade made 147.645 − 145.099 = 2.546 = 254.6
pips (on USDJPY 1 pip = 0.01).
Crosses help most as a description of the trend (“the 20 is above the 50, so the trend is
up”), which is how lesson 5.3 uses the EMAs.
From August to December 2025 EURUSD went sideways, between 1.14687 (5 November low) and
1.19186 (17 September high). The two lines kept crossing:
Cross
Trade
Closed at the next cross
Result
18 Aug, down
sell at 1.16602
8 Sep, 1.17629
−102.7 pips
8 Sep, up
buy at 1.17629
16 Oct, 1.16867
−76.2 pips
16 Oct, down
sell at 1.16867
11 Dec, 1.17376
−50.9 pips
Three crosses, three losses, 229.8 pips in total, before spread and commission. Each cross
came after price had already moved, and in a range that move was about to reverse. The
lines crossing back and forth is itself the warning: the trend has gone.
5 In the terminal: crosses in a trend and in a range
On your practice account:
Open EURUSD on the D1 chart and add MA 20 and MA 50.
Scroll to February to August 2025. Find the cross up in February and the cross down in
August. Notice how far price had already moved before each one.
Scroll on to August to December 2025. Count the crosses, and for each one check where
price went next.
Look at the gap between the two lines. In the trend it was wide: from March to July 2025
it reached about 300 pips. In the range, from 18 August to 11 December 2025, it never
went past about 76 pips, and the lines kept tangling.
A wide gap between lines that both point the same way is a trend. Tangled, flat lines are a
range, and in a range crossovers lose.