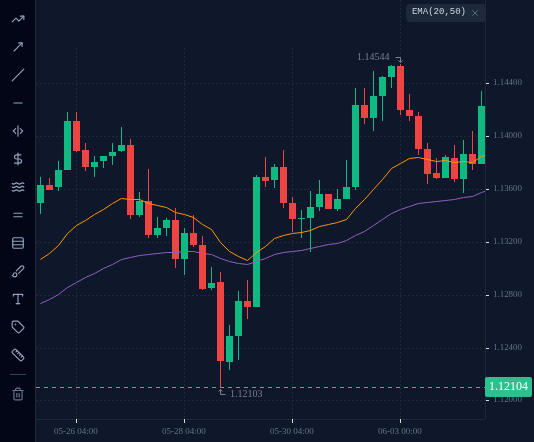
In a trend, price moves in steps, with pullbacks between them. The EMA pullback setup waits for price to fall back to the EMA 20 or EMA 50, then enters on a candle that turns back with the trend, with the stop below the pullback and the target at twice the risk. The worked example shows the same pullback giving one loss, then one win.
In this lesson you learn the full EMA pullback setup, follow it step by step through a real EURUSD
pullback from June 2025 that gave one losing trade and then one winning trade, size both with the
1% rule, and place one yourself on your practice account.
1 Trends move in steps
Even a strong trend does not go up in a straight line. It rises, pulls back part of the way,
then rises again. Buying at the top of a step means a wide stop and a poor price. Buying after
a pullback means a better price and a stop that has a clear place to go.
Fast EMAs give you a simple way to see where pullbacks tend to end. In an uptrend the
EMA 20 and EMA 50 sit under price, and pullbacks often stall somewhere around them.
Often, not always. The rules below decide when you act.
2 The rules, for a buy
Use them on the H4 chart, with the 200 MA filter from lesson 5.2 on D1.
Trend: on D1, price is above a rising 200 MA (at least 10 pips higher than 20 candles
ago, lesson 5.2). On H4, the EMA 20 is above the EMA 50
and the EMA 50 is rising. (The EMA 20 often flattens during the pullback; that is fine.)
Pullback: price falls back to the EMA 20, or into the gap between the EMA 20 and the
EMA 50, without an H4 candle closing below the EMA 50.
Trigger candle: a candle that closes higher than it opened and closes above the
high of the candle before it. That shows buyers taking over again.
Entry: at the open of the next candle.
Stop-loss: a couple of pips below the lowest low of the pullback.
Take-profit: twice the risk (1:2, lesson 1.5).
Size: so that the stop costs at most 1% of the account (lesson 1.4).
For a sell, flip everything: price below a falling 200 MA, the EMA 20 below a falling EMA 50, a
pullback up to the EMAs, and a trigger candle that closes below the low of the candle
before it.
If any rule is missing, there is no trade. Waiting is part of the setup.
Quick check
3 Worked example: EURUSD H4, June 2025
Trend. On D1, EURUSD was well above a rising 200 MA: about 24 pips higher than 20 candles
before (lesson 5.2). On H4, the EMA 20 was above the EMA 50 and both were rising. On 2 June
price rallied, reaching 1.14544 early on 3 June (UTC).
Pullback. Price then fell back. In the 12:00 UTC candle of 3 June it touched 1.13639,
below the EMA 20 (about 1.1383) and above the EMA 50 (about 1.1350). No H4 candle closed
below the EMA 50.
First trigger: 3 June, 20:00 UTC. That candle opened at 1.13684 and closed at 1.13840,
above the previous candle’s high of 1.13833. Every rule was met, so the plan was:
Entry: the next candle opened at 1.13838, so entry about 1.1384.
Stop-loss: below the pullback low of 1.13639, at 1.1362.
Risk: 1.1384 − 1.1362 = 0.0022 = 22 pips.
Take-profit: 1.1384 + (2 × 0.0022) = 1.1428.
What happened. The pullback was not over. In the 04:00 UTC candle of 4 June price fell to
1.13568, just above the EMA 50 (about 1.1354), and hit the stop. Loss: 1%. The rules were
followed and the trade lost. That happens.
Second trigger: 4 June, 12:00 UTC. Still no H4 close below the EMA 50, so the pullback
was still valid, now with a lower low of 1.13568. The 12:00 UTC candle opened at 1.13792 and
closed at 1.14233, above the previous candle’s high of 1.14039. A new plan:
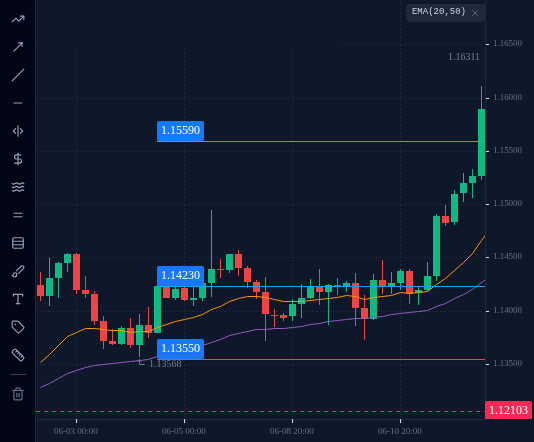
Entry: the next candle opened at 1.14234, so entry about 1.1423.
Stop-loss: below the new pullback low of 1.13568, at 1.1355.
What happened. The lowest price after entry was 1.13715 on 6 June, about 16 pips above
the stop. The take-profit was reached in the 08:00 UTC candle of 12 June (high 1.16105).
One loss of 1%, then one win of 2%. You cannot tell in advance which trigger will work, so
you take each one at 1% and let the 1:2 target pay for the losers. Lesson 5.5 shows the same
rules losing in a market with no trend.
On the EURUSD H4 chart of 3 June 2025, with EMA 20 and EMA 50, click the close of the first trigger candle, the first candle after the pullback began that closed higher than it opened and above the previous candle's high.
EURUSD, H4, up to 2025-06-03 (UTC).
Tap or click the chart to pick a spot, then press Check. Keyboard: focus the chart, then arrow keys move the crosshair (Shift for bigger price steps), Enter picks.
Loading chart…
4 Size it with the 1% rule
Say the account holds US$10,000 and you risk 1%. On EURUSD, 1.00 lot pays US$10 per pip, and
lot sizes go in steps of 0.01. Always round down: rounding up would risk more than 1%.
First trade (22-pip stop).
Money at risk: 10,000 × 1% = US$100.
Money per pip: 100 ÷ 22 pips = US$4.545 per pip, which is 0.4545 lot.
Round down to 0.45 lot, US$4.50 per pip.
The stop was hit: 22 × 4.50 = US$99.00 lost. The account now holds US$9,901.
Second trade (68-pip stop). The wider stop means a smaller lot for the same 1%.
Money at risk: 9,901 × 1% = US$99.01.
Money per pip: 99.01 ÷ 68 pips = US$1.456 per pip, which is 0.1456 lot.
Round down to 0.14 lot, US$1.40 per pip. (On a full US$10,000 it is also 0.14 lot.)
At 0.14 lot, hitting the stop would have cost 68 × 1.40 = US$95.20. The take-profit paid
136 × 1.40 = US$190.40. After both trades the account is up 190.40 − 99.00 =
US$91.40. Spread and commission change these numbers slightly.
Quick check
5 In the terminal: mark entry, stop and target
On your practice account:
Open EURUSD on the H4 chart and add EMA 20 and EMA 50.
Scroll to 3 June 2025 and find the first trigger candle at 20:00 UTC. Step forward to
4 June 04:00 UTC and watch it reach the stop at 1.1362.
Find the second trigger candle, 4 June 12:00 UTC. Draw three horizontal lines: the entry
(1.1423), the stop (1.1355) and the target (1.1559). Then step forward and watch how
price moved between them.
Now go to the latest candles. Check the 200 MA on D1 first. If EURUSD, GBPUSD or USDJPY
shows all the rules on H4, open the order ticket, set the volume from the 1% rule, and set
the stop-loss and take-profit fields before you send the order.
If no pair shows the setup, do not force one. Check again after the next few H4 candles.
EURUSD H4 chart up to 12 June 2025, 08:00 UTC with EMA 20 and EMA 50 and 3 lines drawn, as described in "In the terminal: mark entry, stop and target".
Open this in the terminal
↗(opens in a new tab)
Check your understanding
0 of 5 questions right. Answer them all to complete the lesson.