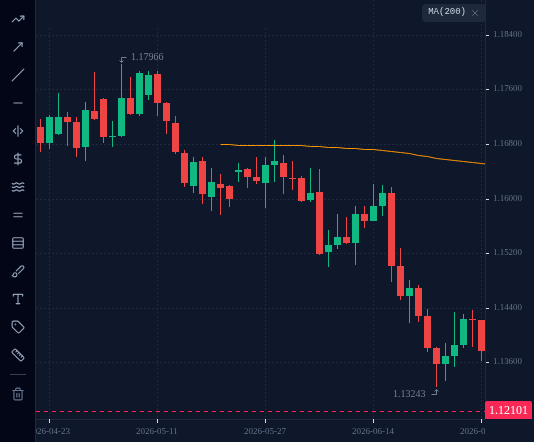
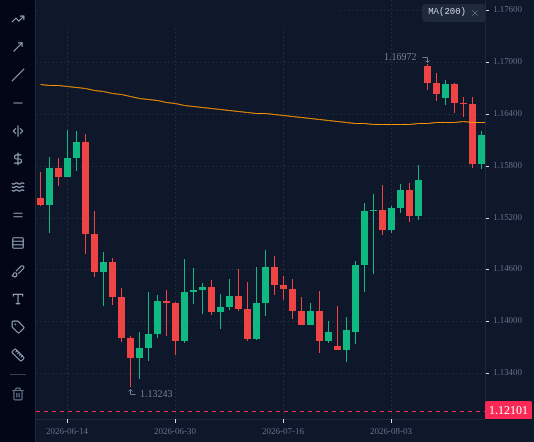
The 200-period moving average on D1 is a simple filter. Price above a rising 200 MA means you only look for buys; price below a falling one means you only look for sells. When the line is flat, the filter tells you little.
In this lesson you use one slow moving average to decide which direction you are allowed to trade,
check its slope, and see on real EURUSD data a year when it worked and six months when it had
nothing to say.
1 One line, one question
Before you look for a trade, ask one question: which way is the bigger trend going?
A slow moving average answers it in a glance. The usual choice is the 200-period moving
average on the D1 chart, the average of roughly the last ten months of daily closes.
The rule is simple:
Price above the 200 MA: look for buys only.
Price below the 200 MA: look for sells only.
This is a filter, not an entry. It does not tell you when to trade. It tells you which
half of the trades to ignore.
2 Check the slope too
Where price sits is only half the picture. The other half is which way the line itself is
pointing.
Rising 200 MA, price above it: a clear uptrend. On 2 June 2025 EURUSD closed at
1.14419. The 200 MA was about 1.0802, and 20 trading days earlier it had been about 1.0778:
rising.
Falling 200 MA, price below it: a clear downtrend. On 1 July 2026 EURUSD closed at
1.13772. The 200 MA was about 1.1652, and 20 trading days earlier it had been about 1.1678:
falling.
Flat 200 MA: no clear trend, whichever side price is on.
To judge the slope, compare the line on the last D1 candle with where it was 20 candles
earlier. In this course:
Rising: at least 10 pips higher than 20 candles ago.
Falling: at least 10 pips lower than 20 candles ago.
Flat: anything less than 10 pips either way.
The two examples above pass easily: about 24 pips higher in June 2025, about 26 pips lower
in July 2026. Every lesson in this module uses this same test.
On 5 March 2025 EURUSD closed at 1.07857, above the 200 MA (about 1.0721) for the first time
that year. The line was still falling, so the filter did not say “buys only” yet.
The line turned up in early April. On 3 April 2025 it was about 11 pips higher than 20
candles before, which passes the rising test, and the filter switched to buys only.
From 5 March 2025 to 2 March 2026, all 263 daily closes stayed above the 200 MA, and from
3 April the line never stopped rising. A trader using the filter spent that whole stretch
looking only for buys, and never sold into a market that climbed from about 1.10 to above
1.20 (high 1.20822 on 27 January 2026).
The filter did not pick the entries. It kept the trader on the right side of the bigger
move.
On the EURUSD D1 chart with the 200 MA, click the first daily close of 2025 that finished above the 200 MA.
EURUSD, D1, up to 2025-03-05 (UTC).
Tap or click the chart to pick a spot, then press Check. Keyboard: focus the chart, then arrow keys move the crosshair (Shift for bigger price steps), Enter picks.
Loading chart…
4 When the line is flat: EURUSD, March to August 2026
From March to August 2026 the EURUSD 200 MA hardly moved. It stayed between about 1.1628 and
1.1680, a band of only about 52 pips in six months.
Price kept crossing it. The daily close switched sides five times: below on 3 March, above on
9 April, below on 14 May, above on 21 August and below again on 28 August.
Put the slope test next to those switches and the filter almost never gave a clear answer:
3 March: price below, but the line still rising from the 2025 trend. No clear trend.
Late March to mid-June: the line flat (it passed the rising test for only one week in
May, by about a pip). No clear trend, whichever side price was on.
Mid-June to 20 August: price below a falling line. Sells only, the one clear stretch.
21 August: price above a line that was still falling. No clear trend.
From 26 August: the line flat again.
That is the filter telling you it has no opinion. When the 200 MA is flat and price keeps
crossing it, treat the market as having no clear trend and look elsewhere, or wait.
From the indicator menu, add MA with a period of 200.
Is the last candle above or below the line?
Is the line at least 10 pips higher, at least 10 pips lower, or within 10 pips of where
it was 20 candles ago?
Write down your answer as “buys only”, “sells only” or “no clear trend”. Do the same on
GBPUSD and USDJPY. You will use this filter in every trade in the rest of this module.