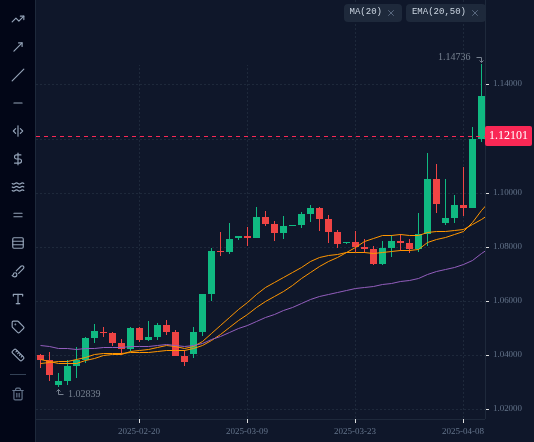
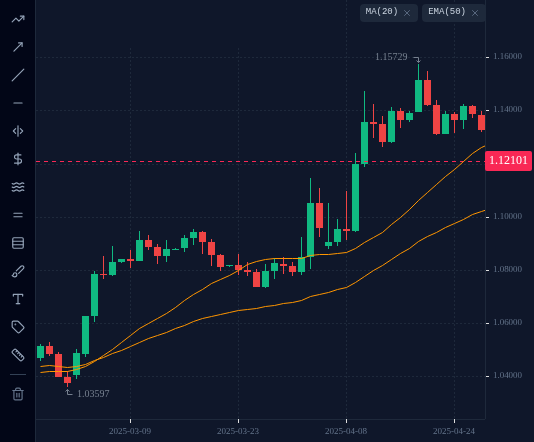
A moving average is the average closing price of the last few candles, redrawn after every candle. It smooths out the noise, but it always runs behind price. The period and the type (simple or exponential) decide how far behind.
In this lesson you learn what a moving average is, work one out by hand from real EURUSD closes,
see how a simple average (MA) differs from an exponential one (EMA), and see why every moving
average runs behind price.
1 An average that moves
A moving average is the average closing price of the last few candles. After every new
candle, the oldest close drops out, the newest close comes in, and the average is worked out
again. Join those averages up and you get a smooth line drawn through the candles.
The number of candles it uses is the period. A 20-period average on a D1 chart is the
average of the last 20 daily closes. On an H4 chart it is the last 20 four-hour closes.
A moving average is not a forecast. It only describes where price has been on average.
2 Working it out by hand: a 5-day average
EURUSD D1 daily closes for the week of 2 to 6 June 2025:
Day
Close
Mon 2 June
1.14419
Tue 3 June
1.13699
Wed 4 June
1.14144
Thu 5 June
1.14444
Fri 6 June
1.13935
Add them up: 1.14419 + 1.13699 + 1.14144 + 1.14444 + 1.13935 = 5.70641.
Divide by 5: 5.70641 ÷ 5 = 1.14128 (rounded to 5 decimals).
That is the 5-period simple average on 6 June. On Monday 9 June the 2 June close drops out,
the 9 June close comes in, and the sum is divided by 5 again.
Quick check
3 Simple (MA) and exponential (EMA)
There are two common types.
Simple moving average. Every close in the period counts the same. In a 20-period
simple average each close is 1 ÷ 20 = 5% of the result. In the Pipstone terminal the
simple average is the indicator called MA.
Exponential moving average (EMA). Recent closes count more than old ones. The newest
close gets a weight of 2 ÷ (period + 1). For a 20 EMA that is 2 ÷ 21 = 0.0952, about
9.5%, nearly twice the weight the simple average gives it. Older closes fade out
gradually instead of dropping off all at once.
Because the newest close counts more, an EMA turns sooner than a simple average with the
same period. A shorter period also turns sooner than a longer one, whatever the type.
Quick check
4 Why every moving average lags
An average of past closes can only catch up with price after price has moved. That delay is
called lag.
A real example. From 2 to 11 April 2025, EURUSD D1 jumped from a close of 1.08490 to a close
of 1.13554, about 506 pips in seven trading days. On the close of 11 April:
MA 20 was about 1.0905, roughly 450 pips below price.
EMA 20 was about 1.0935, roughly 420 pips below price.
EMA 50 was about 1.0777, roughly 578 pips below price.
All three were far behind. The EMA 20 was closest, the EMA 50 furthest. The longer the
period, the smoother the line and the bigger the lag. There is no setting with no lag:
smoothness and speed are a trade-off.
From the indicator menu, add MA with a period of 20 (the simple average).
Add EMA with a period of 50.
Scroll back to March and April 2025 and watch the two lines while price jumps in early
April.
You will see two lines that follow price, both trailing behind it. Look at which line bends
first after price changes direction, and which one stays closer to the candles. Then answer
the check question below.