Candle patterns lose too. Three real losing trades on EURUSD show the usual ways it goes wrong, a pattern against the trend, a pattern on a very low timeframe, and a news candle mistaken for a pattern.
In this lesson you replay three real losing trades built on correct-looking candle patterns, so you
can recognise the context that made each one fail. A planned loss with a stop is normal. A pattern
traded without its context is how small mistakes repeat.
1 Patterns fail, and that is normal
Lessons 4.2 to 4.5 showed patterns at levels, some that worked and some that did not. This
lesson shows three real losing trades, each one a different, common mistake.
In the terminal: replay each example one candle at a time. Decide what you would have done
before you see the next candle.
Every example uses 0.10 lot of EURUSD, so 1 pip = US$1.
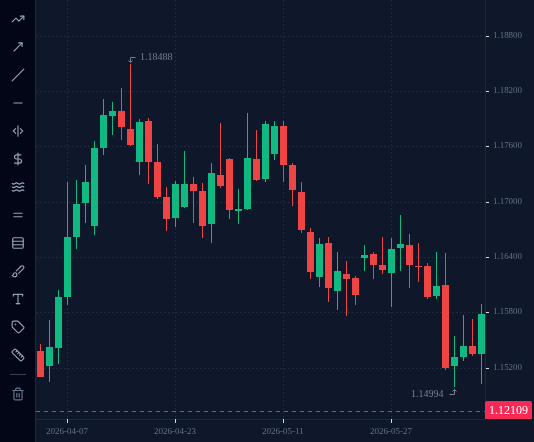
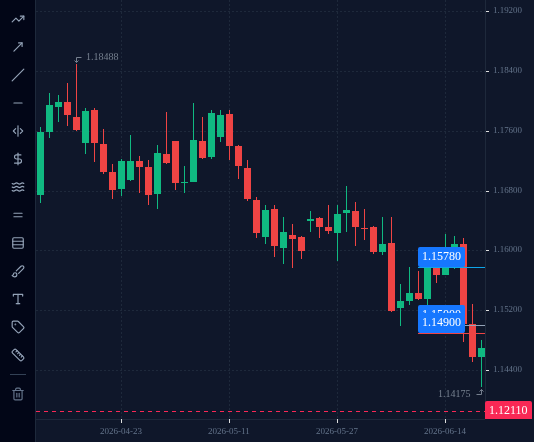
Pattern and level. On 10 June a small down candle (open 1.15432, close 1.15348). On
11 June an up candle: open 1.15348, low 1.15027, close 1.15779. A bullish engulfing, with its
low just above the 1.1500 round number (lesson 2.4).
A trader bought at 1.1578 with the stop at 1.1490, below the round number.
Risk: 1.1578 − 1.1490 = 88 pips.
15 June: price reached 1.16216, 44 pips in the trade’s favour.
17 June, 19:00 UTC hour: price fell to 1.14778 and hit the stop. Loss: US$88.
Pattern: yes. Level: yes. Trend: against. Compare the 31 March engulfing in lesson 4.3: there
the lows had stopped falling and the market was in a range. Here the lows were still falling,
1.15759 on 21 May and then 1.15173 on 5 June, only days before the pattern. In a downtrend, a
bullish pattern at support is a bet that the whole move turns at that point. Sometimes it
does. This time it did not.
3 Failure 2: a pattern on a 15-minute chart (October 2026)
This time the trend was right. On D1, EURUSD closed at 1.16124 on 4 September 2026 and at
1.13420 on 29 September: a clear fall.
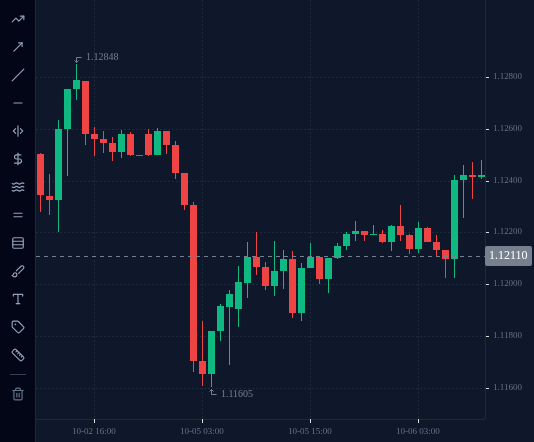
On the M15 chart on 6 October, the 07:15 UTC candle was a textbook bearish pin bar:
open 1.12141, high 1.12229, low 1.12136, close 1.12142. Upper wick 8.7 pips of a 9.3-pip
range, 94%.
A trader sold at 1.1214 with the stop at 1.1225, 2 pips above the high.
Risk: 11 pips.
07:30 UTC: the very next candle reached 1.12307 and hit the stop. Loss: US$11.
By 08:45 UTC price had reached 1.12462.
A 15-minute candle records a few minutes of trading. A few orders can make a pin bar, and the
ordinary noise of the next few minutes can wipe it out. The stop has to be tiny, so costs
weigh more: a 1-pip spread is about 9% of an 11-pip stop (1 ÷ 11), but under 2% of a 64-pip
stop (1 ÷ 64). The patterns in this module were read on H4 and D1 for that reason.
The terminal link opens the H1 chart, because M15 history only goes back about three months.
The pin bar and the stop-out both sit inside the 07:00 UTC H1 candle, which ran from 1.12025
to 1.12422. On H1 the “textbook” pin bar does not even show.
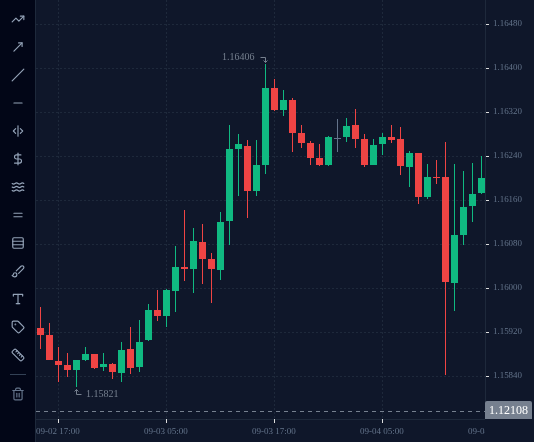
On 4 September 2026 EURUSD was quiet. On M15, the nine candles from 10:15 to 12:15 UTC each
covered between 2.4 and 5.0 pips.
Then the 12:30 UTC candle: open 1.16256, high 1.16256, low 1.15843, close 1.15985. A
41.3-pip range and a 27.1-pip down body that swallowed the bodies of every candle in the two
hours before it. On shape alone, a huge bearish engulfing.
12:30 UTC is 8:30 in New York, the time many scheduled US economic reports are published.
A candle like this is not buyers and sellers testing a level. It is the whole market reacting
to new numbers at once, often while spreads are wider than usual.
A trader sold at the 12:45 open, 1.15986, with the stop at 1.1628, just above the
candle’s high. Risk: 1.1628 − 1.15986 = 29.4 pips.
The 14:00 candle closed at 1.16129, already 14.3 pips against the trade.
Monday 7 September, 08:00 UTC hour: price reached 1.16353 and hit the stop.
Loss: US$29.40.
Before trusting any big candle, check an economic calendar for the time it formed. If it
formed on a scheduled release, it is a news candle, not a pattern.
The terminal link opens the H1 chart, because M15 history only goes back about three months.
The news candle stands out there too: the 12:00 UTC H1 candle covered 42.2 pips, against 4.4 to
9.3 pips for the three hours before it.
None of the three losses came from a badly drawn candle. Each pattern matched its
definition. What failed was the context:
Against the trend: the pattern fought the direction the market was moving.
Low timeframe: the candle was too small to mean anything, and the stop too tight to
survive normal noise.
News: the candle was a reaction to a scheduled release, not a test of a level.
In all three, the stop-loss limited the damage to a planned amount. Keep the checklist from
lesson 4.5, add “is this candle a news candle?” to it, and expect losses even when you follow
it. Most retail CFD accounts lose money. A stop on every trade and a 1% limit are how you keep
losses small enough to learn from.
0 of 4 questions right. Answer them all to complete the lesson.