A candle pattern alone is not a reason to trade. A setup needs three things together, the pattern, a support or resistance level, and the trend, plus an entry, stop and target decided before you trade.
In this lesson you combine the candle patterns with Module 2’s levels and the trend into one
checklist, follow a real setup from plan to outcome, and see the same kind of pattern lose when it
formed in the wrong place.
1 Three things, not one
Lessons 4.2 and 4.3 showed the same thing twice. The same pattern worked in one place and
failed in another. The difference was where it formed.
A setup needs three things at once:
Pattern: a pin bar, engulfing candle or inside-bar break.
Level: the pattern forms at a support or resistance zone from Module 2.
Trend: the pattern points the same way as the trend. In a downtrend (lower highs and
lower lows) look for bearish patterns at resistance. In an uptrend (higher highs and higher
lows) look for bullish patterns at support. In a range (the highs and lows have stopped
making new extremes) look for bullish patterns at the bottom edge and bearish ones at the
top edge, as in Module 2. The 31 March engulfing in lesson 4.3 is this case.
Then you decide the entry, the stop-loss beyond the level and the take-profit before the next
level, and size the trade so the stop costs at most 1% (Module 1).
If one of the three is missing, there is no setup. Doing nothing is a decision too.
Quick check
2 A full setup: EURUSD D1, 27 May 2026
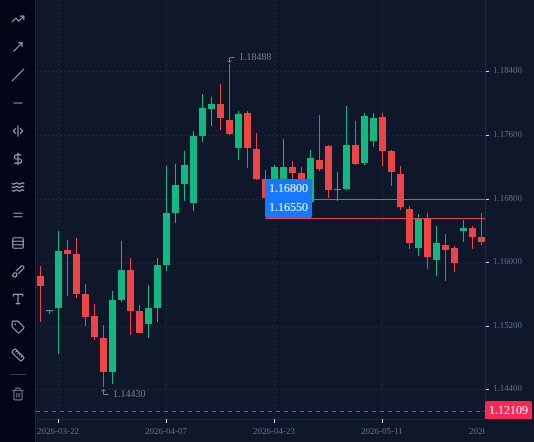
Trend. EURUSD was falling. Highs: 1.17966 (6 May), 1.17877 (11 May), 1.16614 (19 May),
each lower than the last. Lows: 1.16548 (30 April), 1.16166 (15 May), 1.15759 (21 May), each
lower than the last.
Level. The support zone at about 1.1655 to 1.1680 broke on 15 May. Broken support often
becomes resistance (lesson 2.3). On 19 May price rose back to it, reached 1.16614 and fell.
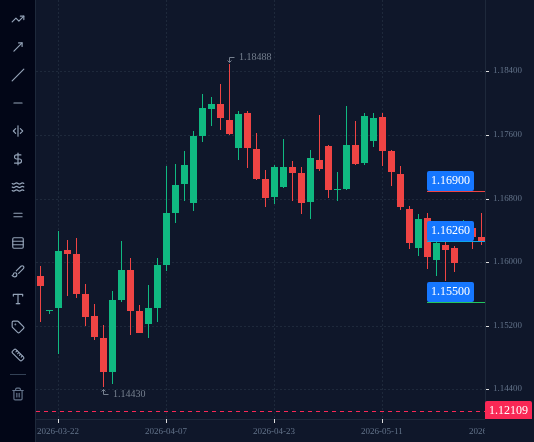
Pattern. On 27 May price rose to the zone again. The candle: open 1.16314, high 1.16614,
low 1.16220, close 1.16259.
Upper wick: 1.16614 − 1.16314 = 30.0 pips of a 39.4-pip range, 76%.
Body: 1.16314 − 1.16259 = 5.5 pips.
A bearish pin bar, at resistance, in a downtrend. Its high was exactly the 19 May high.
All three boxes ticked.
Decided before the trade, using the method from lesson 2.5:
Entry: sell at about 1.1626, the 27 May close.
Stop-loss:1.1690, above the top of the zone (1.1680) with 10 pips of room.
Take-profit:1.1550, just before the support zone at about 1.1520 to 1.1545
(lesson 2.6). On the way, price may pause at the May lows, about 1.1576 to 1.1588.
The distances:
Risk: 1.1690 − 1.1626 = 0.0064 = 64 pips.
Reward: 1.1626 − 1.1550 = 0.0076 = 76 pips, about 1.2 times the risk.
The size, for a US$6,400 account risking 1%:
Money at risk: 6,400 × 1% = US$64.
Money per pip: 64 ÷ 64 pips = US$1 per pip, which on EURUSD is 0.10 lot.
27 May setup. On 28 May price rose to 1.16611. On 29 May it spiked to 1.16855,
59.5 pips against the trade and 4.5 pips short of the stop. Then it fell. On 5 June, in the
14:00 UTC hour, it went through 1.1550 and the take-profit was reached: +76 pips, US$76 at
0.10 lot, before spread and commission. A good setup can still come within a few pips of
the stop. With the stop 5 pips tighter, this trade would have lost.
A pattern in the wrong place: 27 July 2026. EURUSD was sitting on the support at the
bottom of the June to July box (about 1.1325 to 1.1370, lesson 2.1). That day printed a
bearish pin bar: open 1.13712, high 1.14179, low 1.13666, close 1.13674, an upper wick of
91% of the range. A perfect shape, pointing into support.
A trader sold at 1.1367 with the stop at 1.1425, above the pin bar’s high.
28 July: the next candle was a bullish engulfing on the same support (open 1.13674,
close 1.13903).
29 July, 18:00 UTC hour: price reached 1.14519 and hit the stop. Loss: 58 pips.
30 July: price reached 1.15366.
Same kind of pattern, opposite result. The level decided it.
Quick check
5 Set up a full trade in the terminal
On your practice account, work through the checklist on today’s chart:
Trend: open EURUSD on D1. Are the last highs and lows getting higher, lower, or
neither? If neither, it is a range: only an edge of the range counts as the level in
step 2.
Level: mark the nearest support and resistance zones (Module 2).
Pattern: look for a pin bar, engulfing candle or inside-bar break at one of those
zones, pointing with the trend. If there is none, stop here. Most days there is none.
Plan: open the order ticket. Set the entry, the stop-loss field beyond the zone and the
take-profit field before the next zone.
Size: work out the volume so the stop costs no more than 1% of the account. Then
place the order.
If you stopped at step 3, that is the right answer for today. Come back tomorrow.