An engulfing candle's body swallows the body before it, a sign that one side took over. At a support or resistance level it can mark a turn; in the wrong place it means very little.
In this lesson you learn to spot bullish and bearish engulfing candles, and to judge them by their
location. One real engulfing at support and one in the wrong place show why the level comes first.
1 One body swallows the other
An engulfing candle is a two-candle pattern. The second candle’s body completely covers
the first candle’s body, in the opposite direction.
Bullish engulfing: a down candle, then an up candle that opens at or below the first
one’s close and closes above the first one’s open.
Bearish engulfing: an up candle, then a down candle that opens at or above the first
one’s close and closes below the first one’s open.
Only the bodies count; the wicks do not. In forex each candle usually opens very close to the
previous close, so in practice you are checking one thing: did the second body close beyond
the first body’s open?
The story: one side was in charge for a whole period, then the other side took back all of it
and more.
Quick check
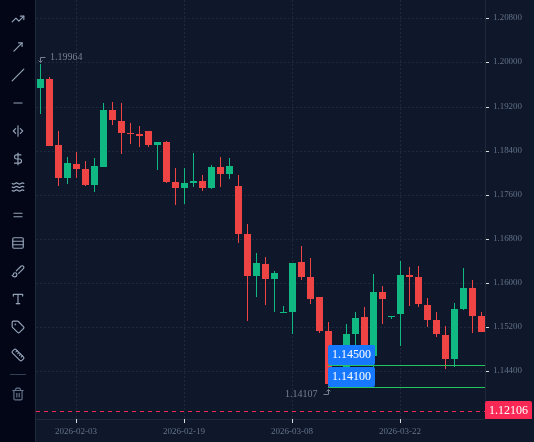
2 Bullish engulfing at support: EURUSD, 31 March 2026
In March 2026 EURUSD kept stopping between about 1.1410 and 1.1450. The daily lows were
1.14107 (13 March), 1.14140 (16 March), 1.14488 (18 March), 1.14425 (19 March) and 1.14430
(30 March). That is a support zone with five touches.
The March fall had also stalled. After 13 March the lows stopped falling (1.14140, 1.14488,
1.14425, 1.14430), and the 23 March high, 1.16396, broke the 19 March high, 1.16164. No
longer a downtrend: a range, with this zone as its bottom edge.
30 March: a down candle. Open 1.15047, close 1.14612. Body 43.5 pips.
31 March: an up candle. Open 1.14611, low 1.14469, close 1.15524. Body 91.3 pips.
The 31 March body ran from 1.14611 to 1.15524 and covered the whole 30 March body (1.14612 to
1.15047). Pattern: bullish engulfing. Location: right on a support zone.
What happened next: the lowest price in the following three weeks was 1.15049 (6 April),
well above the engulfing candle’s low. On 14 April, in the 11:00 UTC hour, price traded above
1.1800. This one worked. Lesson 4.6 shows ones that did not.
On the EURUSD D1 chart from 9 March to 3 April 2026, click the bullish engulfing candle that formed on the support zone at about 1.1410 to 1.1450.
EURUSD, D1, up to 2026-04-03 (UTC).
Tap or click the chart to pick a spot, then press Check. Keyboard: focus the chart, then arrow keys move the crosshair (Shift for bigger price steps), Enter picks.
Loading chart…
3 Big candle, far stop
Engulfing candles are often large, so a stop-loss beyond the level ends up far from the
entry. That changes your lot size, not your risk.
Say you bought at the 31 March close, 1.15524, with a stop at 1.1400, about 11 pips below the
lowest low in the zone (1.14107).
Money per pip: 100 ÷ 152.4 = about US$0.66 per pip. At US$10 per pip for 1.00 lot,
that is about 0.066 lot, so round down to 0.06 lot.
Rounding down keeps the risk under 1%: 152.4 pips × US$0.60 = US$91.44.
Quick check
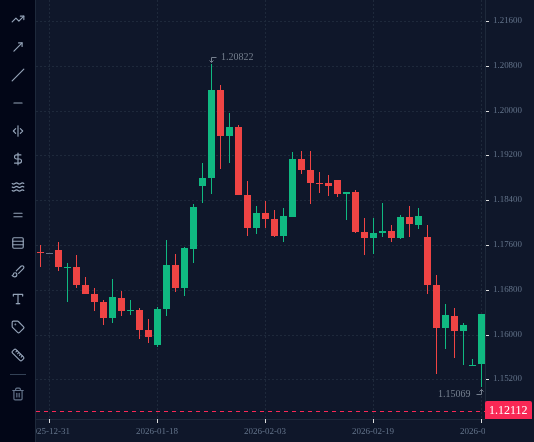
4 Bullish engulfing in the wrong place: 20 April 2026
Three weeks later EURUSD printed another bullish engulfing on D1.
17 April: a down candle. Open 1.17790, close 1.17616. This is the candle from lesson
4.1 whose upper wick reached 1.18488 and was rejected.
20 April: an up candle. Open 1.17432, low 1.17285, close 1.17859. Its body covered the
17 April body.
Same pattern, different location. The 20 April candle closed at 1.17859, right inside the
area sellers had just rejected (1.17790 to 1.18488), with the 14 April high (1.1811) and the
16 April high (1.18237) just above. It was buying into resistance, not at support.
The next day, 21 April, price fell below the engulfing candle’s low. On 23 April it reached
1.16688.
Quick check
5 Replay an engulfing at support
In the terminal, on EURUSD D1:
Go to early March 2026. The support zone (about 1.1410 to 1.1450) is drawn for you.
Use replay to step forward one candle at a time from 9 March.
Each time price reaches the zone, stop and ask: is there a pattern here, and is it at the
level?
When you reach 31 March, measure both bodies with the crosshair and confirm the engulfing.
Keep stepping to 14 April and watch what price does after it.
Then repeat from 14 April to 23 April and watch the 20 April engulfing fail.