A pin bar is a candle with one long wick and a small body, a record of price being rejected. It only matters where the rejection happens, at a support or resistance level.
In this lesson you learn to recognise pin bars, measure them, and judge them by where they form.
Two real pin bars at Module 2 levels, and one in the middle of nowhere, show the difference.
1 What a pin bar is
A pin bar is a candle with one long wick and a small body at the other end. The long wick
“pins” a price that was reached and then rejected.
A common working definition:
The long wick is about two thirds of the candle’s range or more.
The body is about a third of the range or less.
The other wick is short.
A bullish pin bar has a long lower wick: sellers pushed price down, buyers pushed it back
up. A bearish pin bar has a long upper wick: buyers pushed price up, sellers pushed it
back down.
The definition is a rule of thumb, not a law. What matters more is where the pin bar forms.
2 A pin bar at support: EURUSD, 28 April 2026
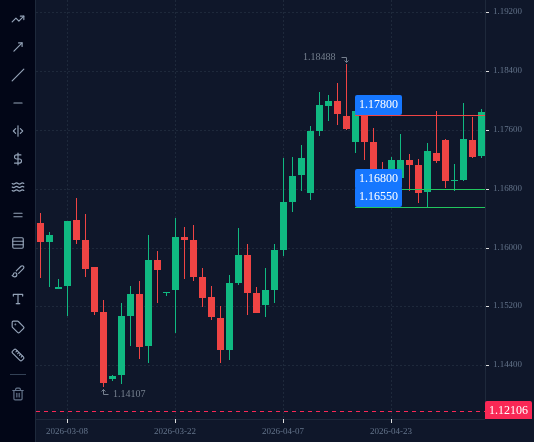
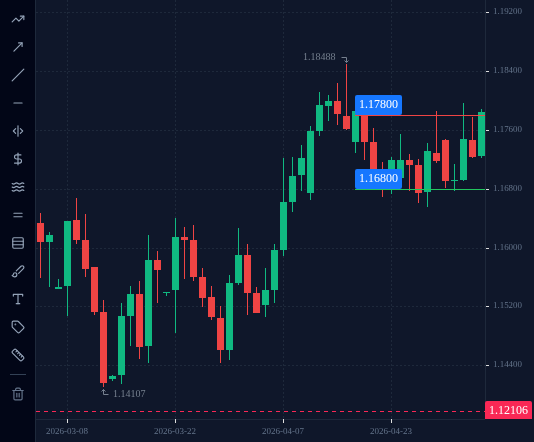
Lessons 2.2 and 2.5 found a support zone on EURUSD D1 at about 1.1655 to 1.1680.
On 28 April 2026 this candle formed: open 1.17191, high 1.17267, low 1.16771, close 1.17118.
Range: 1.17267 − 1.16771 = 49.6 pips.
Lower wick: 1.17118 − 1.16771 = 34.7 pips, which is 34.7 ÷ 49.6 = 70% of the range.
Body: 1.17191 − 1.17118 = 7.3 pips, about 15% of the range.
The low, 1.16771, sat inside the support zone. Sellers drove price into the zone and buyers
pushed it back out. That is a pin bar where a pin bar means something.
The same range also had a bearish pin bar at its top. On 1 May 2026 price reached 1.17852,
inside the resistance zone at about 1.1782 to 1.1797, and closed at 1.17169. The upper wick
was 56.5 of the 70.0-pip range, 81%.
On the EURUSD D1 chart from 20 April to 8 May 2026, the support zone is about 1.1655 to 1.1680. Click the bullish pin bar whose low is inside that zone.
EURUSD, D1, up to 2026-05-08 (UTC).
Tap or click the chart to pick a spot, then press Check. Keyboard: focus the chart, then arrow keys move the crosshair (Shift for bigger price steps), Enter picks.
Loading chart…
3 The wick is not the level
What happened after the 28 April pin bar (H1 candles, UTC):
29 April, 18:00 hour: price fell to 1.16609, 16 pips below the pin bar’s low.
30 April: it went as deep as 1.16548, the bottom edge of the support zone.
1 May, 14:00 hour: it reached 1.17852, at the resistance zone.
A stop-loss a few pips under the pin bar’s wick was hit the next day. A stop-loss below the
whole zone, at 1.1640 as in lesson 2.5, was not. The pin bar showed the level was being
defended. The level, not the wick, is where your stop belongs.
The bearish pin bar of 1 May was followed by a fall to 1.16808 on 4 May. On 6 May, in the
10:00 hour, price went back above its high, to 1.17966. Pin bars at good levels fail too.
Quick check
4 A pin bar in the middle of nowhere
From 24 June to 28 July 2026 EURUSD traded in a box from 1.13243 to 1.14822 (lesson 2.6).
On 6 July 2026 this candle formed: open 1.14357, high 1.14446, low 1.14082, close 1.14396.
Its lower wick was 27.5 of a 36.4-pip range, 76%. By shape it was a fine bullish pin bar.
By location it was not. Its low was about 84 pips above the bottom of the box and its close
about 43 pips below the top. There was no level under it for buyers to defend. On 8 July
price traded at 1.13909, 17 pips below the pin bar’s low.
Shape tells you a rejection happened. Location tells you whether the rejection matters.
Quick check
5 Find pin bars at levels in the terminal
In the terminal, on EURUSD D1:
Open the chart for April and May 2026. The support and resistance lines from Module 2 are
already drawn.
Step through the candles one at a time. For each candle with a long wick, ask two
questions: is the wick about two thirds of the range or more, and does it touch a level?
Mark the pin bars that pass both tests. Then look at the pin bars that pass only the first.
Most long-wick candles you find will not be at a level. Those are the ones to ignore.