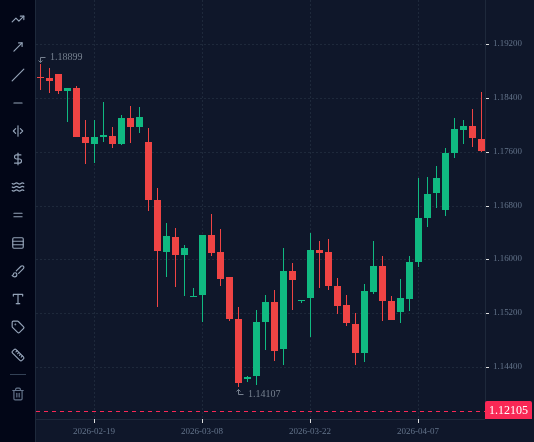
Every candle records four prices. The body shows where price opened and closed, the wicks show how far buyers and sellers pushed before they were pushed back.
In this lesson you learn to read one candle properly: its four prices, its body and its wicks, and
what each part says about buyers and sellers. Every pattern in this module is built from these parts.
1 Four prices in one shape
You met candles in lesson 0.6. This module looks at them more closely, because the shape of
a candle tells you what happened inside it.
Every candle records four prices for its time period:
Open: the first price of the period.
High: the highest price reached.
Low: the lowest price reached.
Close: the last price of the period.
If the close is above the open, it is an up candle: price rose over the period. If the
close is below the open, it is a down candle. Charts colour the two kinds differently.
2 Body and wicks
A candle has two parts.
The body is the thick part, from the open to the close. Its size shows how far price
moved over the whole period.
The wicks (also called shadows) are the thin lines above and below the body. The upper
wick runs from the top of the body to the high. The lower wick runs from the bottom of the
body to the low.
To measure them:
Body = close − open (or open − close for a down candle).
Upper wick = high − the top of the body.
Lower wick = the bottom of the body − low.
A real up candle, EURUSD D1, 31 March 2026: open 1.14611, high 1.15632, low 1.14469, close
1.15524.
Buyers took price almost 70 pips above the open. By the close, sellers had pushed it all the
way back and a little further. The long upper wick is the record of that rejection.
Quick check
4 Read a candle in the terminal
In the terminal, on EURUSD D1:
Scroll to April 2026 and find the 17 April candle, the one with the long upper wick.
Move the crosshair over it. The terminal shows that candle’s open, high, low and close.
Check the four numbers against the ones above, then work out the body and both wicks
yourself.
Do the same for the candles on either side of it and compare their shapes.
Reading the four prices off a candle, rather than guessing from its shape, is the habit the
rest of this module needs.
On the EURUSD D1 chart from 13 to 24 April 2026, click the candle with the longest upper wick.
EURUSD, D1, up to 2026-04-24 (UTC).
Tap or click the chart to pick a spot, then press Check. Keyboard: focus the chart, then arrow keys move the crosshair (Shift for bigger price steps), Enter picks.
Loading chart…
5 One candle is not a forecast
The 17 April wick showed sellers winning that day. It did not tell you what came next. On
Monday 20 April price rose again, to 1.17901. Only after that did it fall, to 1.16688 on
23 April.
A candle is a record of one period. On its own it says nothing about the next one. The rest of
this module is about the few places where a candle’s story matters more: at the support and
resistance levels from Module 2.
0 of 4 questions right. Answer them all to complete the lesson.