Ranges are full of short runs of higher lows and higher highs that look like trends. Three real losing setups, on EURUSD, USDJPY and gold, show how it goes wrong and what to check before you call a trend.
In this lesson you replay three real ranges that looked like trends, on EURUSD, USDJPY and gold,
and learn the checks that would have flagged them.
1 Seeing trends that are not there
Lessons 3.1 to 3.5 showed trends that were real. This lesson shows the opposite: short runs
of higher lows and higher highs inside a range, which look like an uptrend for a few
weeks and then go nowhere.
Each example below uses the same simple plan, so you can compare them:
Entry: buy on the daily close that makes a new higher high after a run of higher lows.
Stop-loss: just below the last higher low.
In the terminal: open each chart on D1 and use replay to step through it one candle at a
time. Decide what you see before you look at the next candle.
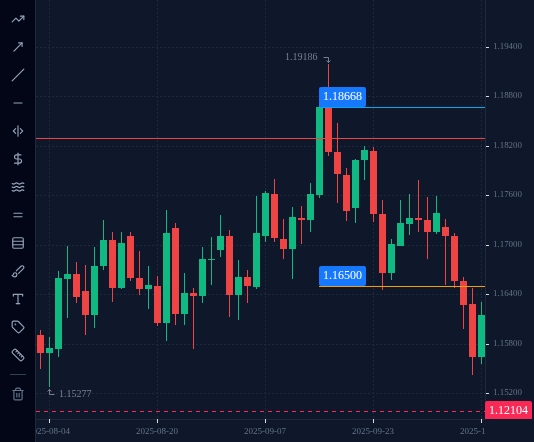
What it looked like. From 27 August 2025 the swing lows rose: 1.15740, 1.16081
(3 September), 1.16589 (11 September). The swing highs rose too: 1.17362 (1 September),
1.17799 (9 September). On 16 September a candle closed at 1.18668, a new higher high.
The trade. Buy at 1.18668, stop at 1.1650, just below the 1.16589 higher low.
17 September: the high was 1.19186. That was the top.
25 September: price fell to 1.16454 and hit the stop. Loss: 1.18668 − 1.16500 =
0.02168, which is 216.8 pips.
Afterwards: 1.15420 on 9 October and 1.14687 on 5 November.
What the bigger picture showed. Zoom out to the whole summer: since July EURUSD had been
moving between 1.13915 (1 August low) and 1.18298 (1 July high). The “uptrend” was three
weeks long, started in the middle of that range and was bought just above its top, where
price had already turned down once.
3 Failed setup 2: USDJPY, August and September 2025
USDJPY pip = 0.01.
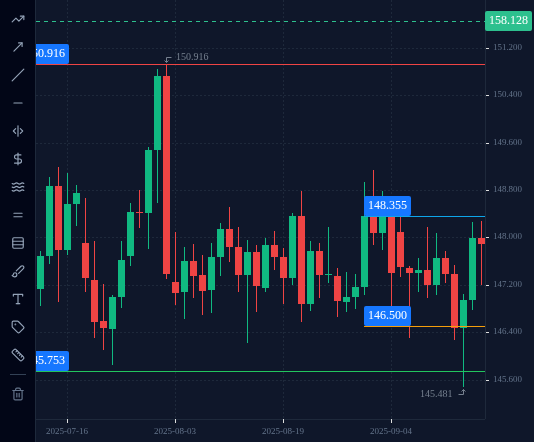
What it looked like. Three swing lows, each a little higher: 146.213 (14 August),
146.572 (22 August), 146.660 (28 August). On 2 September a strong candle closed at
148.355, above the 27 August high of 148.183.
The trade. Buy at 148.355, stop at 146.50, just below the 146.660 higher low.
3 September: the high was 149.136. That was the top.
9 September: price fell to 146.309 and hit the stop. Loss: 148.355 − 146.500 = 1.855,
which is 185.5 pips.
17 September: 145.481.
What the bigger picture showed. From 10 July to mid-September 2025 USDJPY moved between about
145.5 (145.753 on 10 July, 145.481 on 17 September) and 150.916 (1 August), a range of about
540 pips. The “higher lows” were only 36 and 9 pips higher than the ones before, and the
highs were not rising at all: 148.777 on 22 August, then 148.183 on 27 August, a lower
high. That is a range with noise in it, not a trend.
XAUUSD (gold) is priced in US dollars per ounce. Assumption used here: 1 lot = 100 ounces,
so 0.01 lot = 1 ounce and every US$1 move costs US$1.
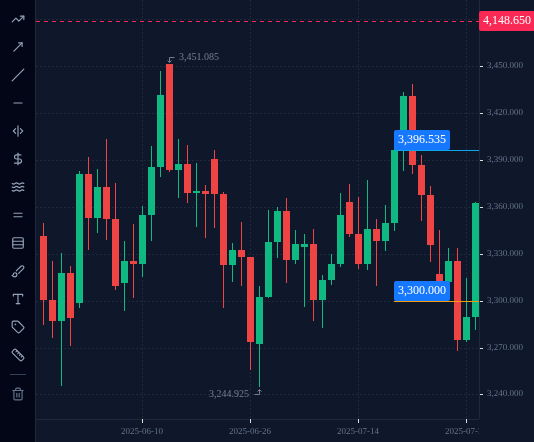
What it looked like. The swing lows rose: 3,244.925 (30 June), 3,282.425 (9 July),
3,309.575 (17 July). On 21 July a candle closed at 3,396.535, above the 16 July high
of 3,377.185.
The trade. Buy 0.01 lot at 3,396.535, stop at 3,300.00, just below the 3,309.575 higher low.
23 July: the high was 3,438.655. That was the top.
28 July: the low was 3,301.465, US$1.47 above the stop.
30 July: price fell to 3,267.955 and hit the stop. Loss: 3,396.535 − 3,300.000 =
US$96.535 per ounce, about US$96.54 on 0.01 lot.
What the bigger picture showed. Since 22 April 2025 gold had been moving between
3,120.205 (15 May low) and 3,499.915 (22 April high). The July “uptrend” ran from the
bottom half of that range up towards its top, and its 3,438.655 peak was still below the
16 June high of 3,451.085.
None of the three plans was reckless: each had a stop-loss, and the stop kept the loss to a
known amount. The mistake was in the reading, not the risk control. Before you call a
trend, check:
Zoom out. Look at three to six months of D1 (or switch to W1). Is your “trend”
inside a range you can see from further away?
Where is it in that range? Buying near the top of a range, or selling near the
bottom, puts your entry where price has already turned before.
Both halves. Are the highs rising as well as the lows? In the USDJPY example they
were not.
Size. Higher lows that are a few pips apart, inside a range hundreds of pips wide,
are noise.
If the answers are unclear, treat the market as a range. Some trades will still lose after
every check; that is what the stop-loss is for.
Check your understanding
0 of 4 questions right. Answer them all to complete the lesson.