Every trend pulls back. A pullback that holds above the last higher low is still an uptrend; a close below it is a break of structure, the first hard sign the trend may be over.
In this lesson you learn to tell a pullback from a possible reversal on real EURUSD charts, one
dip that held in 2025, one trend that ended in 2026, and one break that did not lead anywhere.
1 Pullback or reversal?
Every uptrend has dips. The hard question is whether a dip is just a pullback (the
trend will carry on) or a reversal (the trend is over). You cannot know for sure, but
the swing points give you a clear rule:
In an uptrend, find the last higher low: the most recent swing low.
While price stays above it, the dip is a pullback. The uptrend structure is intact.
When a candle closes below it, that is a break of structure. The run of higher
lows is over.
A downtrend works the same way upside down: a close above the last lower high breaks it.
Use the close, not the wick. A wick through a level shows price visited it; a close shows
it stayed there when the candle ended.
Quick check
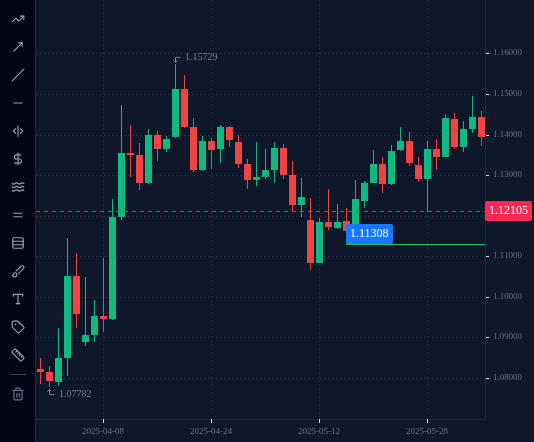
2 A pullback that held (EURUSD, May 2025)
EURUSD D1, the uptrend from lesson 3.2.
16 May 2025: swing low 1.11308. This is the last higher low.
26 May: new higher high, 1.14185.
27 to 29 May: price fell for three days, down to 1.12103 on 29 May. That is 208 pips
off the high, and it looks scary on the chart.
But 1.12103 is still about 80 pips above the last higher low (1.11308). No close came
near it. The same day closed at 1.13649.
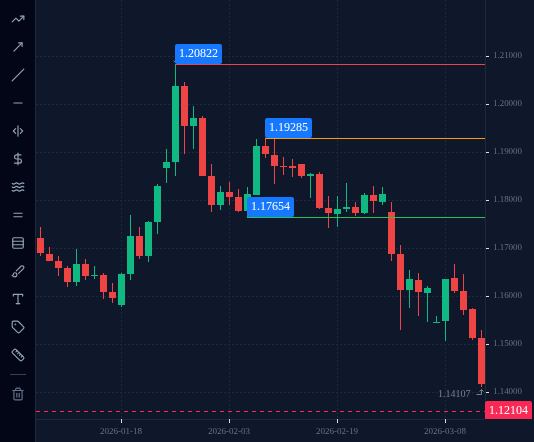
EURUSD D1, 27 January to 13 March 2026. The last higher low was 1.17654 (6 February). Click the close of the first daily candle that closed below it, the break of structure.
EURUSD, D1, up to 2026-03-13 (UTC).
Tap or click the chart to pick a spot, then press Check. Keyboard: focus the chart, then arrow keys move the crosshair (Shift for bigger price steps), Enter picks.
Loading chart…
4 In the terminal: replay the trend ending
Open EURUSD on D1 and use replay to start on 27 January 2026. Step forward one candle at a
time and, at every candle, answer three questions before you look at the next one:
What is the last higher low right now?
Has any candle closed below it?
Was the last rally a higher high or a lower high?
Stop at 2 March. You should have written down the lower high on 10 February, the wick
(not a close) through 1.17654 on 19 February, and the close below it on 2 March.
A break of structure tells you the old trend is in doubt. It does not tell you a new trend
in the other direction has started.
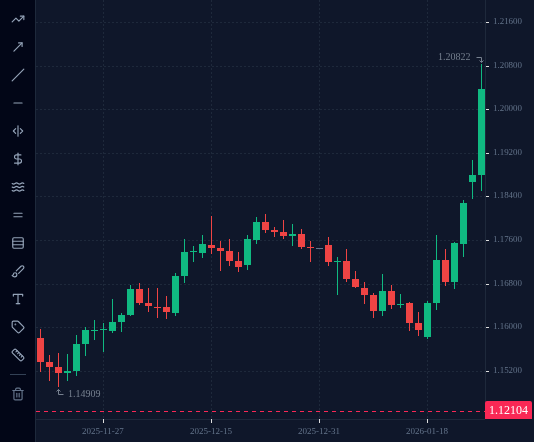
Real example from just before the one above. On 19 December 2025 EURUSD made a higher low
at 1.17021. On 6 January 2026 a candle closed at 1.16885, below it: a break of structure.
Price did fall further, to 1.15777 on 19 January. Then it turned and on 27 January reached
1.20822, above the September 2025 high of 1.19186.
Anyone who sold on 6 January and held on without a stop-loss gave back every pip and more.
After a break, stop looking for buys in the old trend; do not assume the next move is
guaranteed.
Check your understanding
0 of 5 questions right. Answer them all to complete the lesson.