Use a higher timeframe to decide the direction and a lower one to time the entry. Each step down should be about 4 to 6 times shorter, such as D1, then H4, then H1.
In this lesson you follow one EURUSD move from December 2025 down three timeframes: D1 for the
direction, H4 for the pullback and H1 for the moment it ended.
1 One market, several pictures
The same pair can be in an uptrend on the daily chart and a downtrend on the hourly chart
at the same moment. Both are true: the hourly chart is showing a pullback inside the bigger
move.
So traders split the job:
A higher timeframe sets the direction. It shows the trend that matters.
A lower timeframe times the entry. It shows when a pullback inside that trend may be
ending.
You only look for trades in the direction of the higher timeframe.
Quick check
2 The 4 to 6 times rule
Each timeframe you step down to should be about 4 to 6 times shorter than the one
above it:
Higher
Lower
How many lower candles in one higher candle
W1
D1
5 trading days
D1
H4
24 ÷ 4 = 6
H4
H1
4
H1
M15
60 ÷ 15 = 4
A common set is D1 for direction, H4 for the setup, H1 for the entry. Jump too far,
say from D1 straight to M5 (288 five-minute candles in a day), and the two charts no longer
show the same move.
Quick check
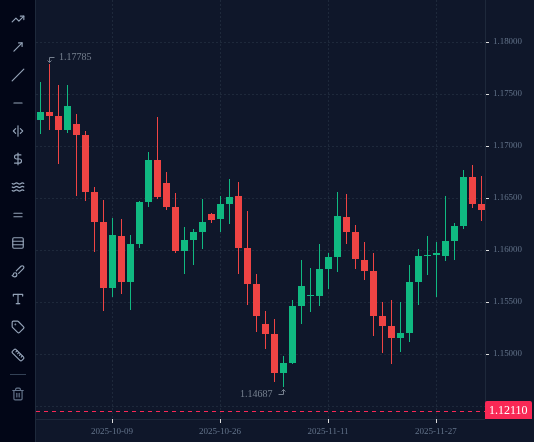
3 D1: the direction (EURUSD, November to December 2025)
EURUSD D1:
Swing lows: 1.14687 (5 November), then 1.14909 (21 November). A higher low.
Swing highs: 1.16559 (13 November), then 1.16819 (4 December). A higher high.
Higher highs and higher lows: on D1 the direction is up. So on the lower timeframes
you only look for the moment a dip ends, not for a fall to sell.
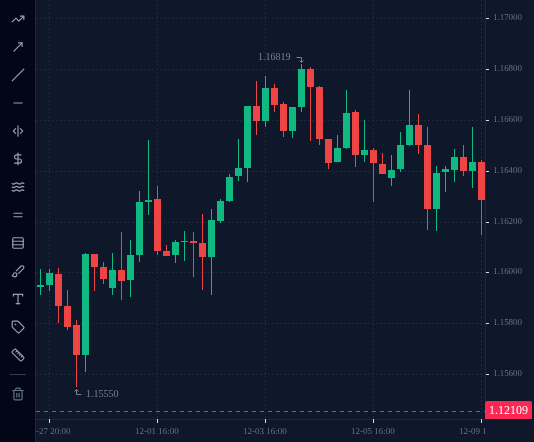
Switch the same chart to H4. After the 08:00 UTC high on 4 December (1.16819), price dipped
for four days. On H4 that looks like a small downtrend, with lower lows:
1.16409 (4 December, 20:00)
1.16279 (5 December, 16:00)
1.16163 (8 December, 16:00)
1.16149 (9 December, 12:00)
That is a pullback inside the D1 uptrend. The lowest point, 1.16149, was still more
than 120 pips above the last D1 higher low (1.14909), so the D1 structure was untouched.
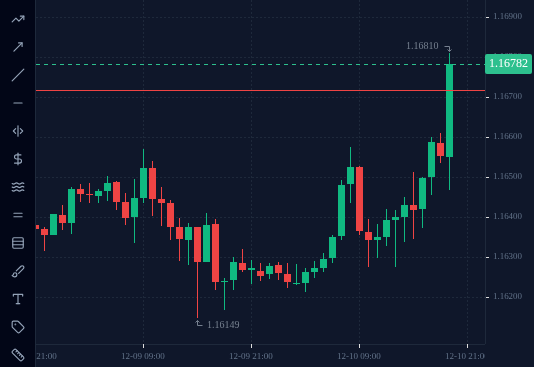
Now switch to H1 and scroll to 5 to 10 December 2025. From 5 December onwards no hourly
candle got above 1.16718 (the 06:00 high on 8 December). The hourly highs were capped.
In the 19:00 UTC hour on 10 December an hourly candle closed at 1.16782, above that
cap. That was the first sign on H1 that the pullback was over, in the same direction as D1.
What happened next: on 11 December price reached 1.17627 (the 17:00 hour), and on
16 December the daily high was 1.18040. This is one example of the timeframes lining up,
not a promise. Lesson 3.6 shows the same kind of reading going wrong.
The terminal’s normal H1 chart does not load back as far as December 2025, so the link
below opens it in replay, stopped on the 19:00 candle. Press Next bar to see what came next.