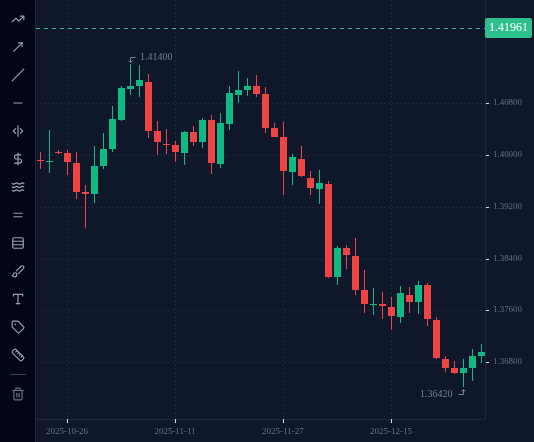
Line up the swing highs and swing lows and the market is doing one of three things. Higher highs and higher lows make an uptrend, lower highs and lower lows make a downtrend, and level highs and lows make a range.
In this lesson you sort three real charts, EURUSD in 2025, USDCAD in 2025 and EURUSD in 2026,
into uptrend, downtrend and range, using nothing but their swing highs and lows.
1 Three kinds of market
Write down the swing highs and swing lows in order, then compare each one with the one
before it of the same kind:
Uptrend: higher highs (HH) and higher lows (HL). Each peak is above the last peak,
each dip stays above the last dip.
Downtrend: lower highs (LH) and lower lows (LL). Each peak is below the last peak,
each dip goes below the last dip.
Range (sideways): the highs stop at about the same level and the lows stop at about
the same level. Neither sequence is rising or falling.
A trend needs both halves. Higher highs with lower lows is not an uptrend; it is a
market getting wider and more unstable.
Quick check
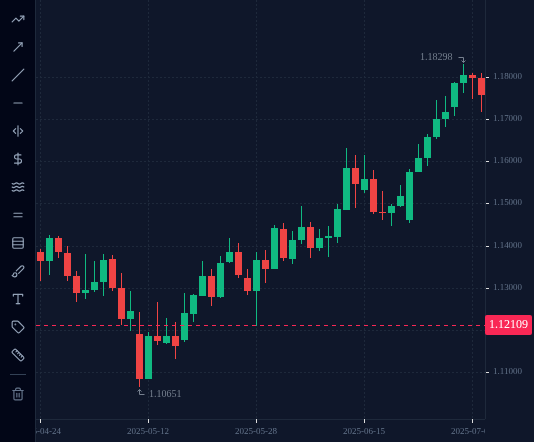
2 Chart A: an uptrend (EURUSD, May to July 2025)
EURUSD D1, 12 May to 3 July 2025.
Swing lows: 1.10651 (12 May), 1.11308 (16 May), 1.12103 (29 May), 1.14461 (19 June).
Each one higher than the last: higher lows.
Swing highs: 1.12655 (14 May), 1.14185 (26 May), 1.14948 (5 June), 1.16311 (12 June),
1.18298 (1 July). Each one higher than the last: higher highs.
Every dip was bought before it reached the previous dip. That is what an uptrend looks like
from the inside.
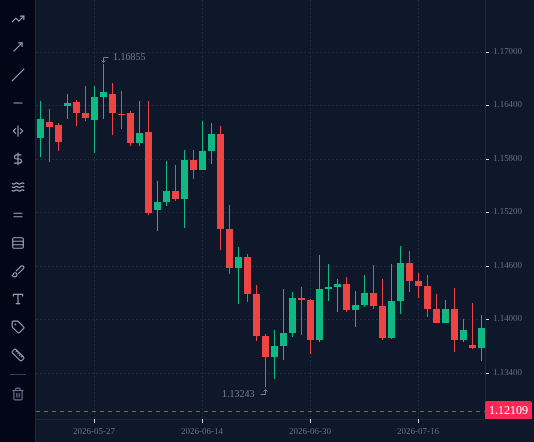
EURUSD D1, 24 June to 28 July 2026. You met this box in lesson 2.1.
Swing highs: 1.14724 (2 July), 1.14822 (15 July), 1.14355 (23 July). Up 10 pips,
then down 47: no direction.
Swing lows: 1.13243 (24 June), 1.13615 (1 July), 1.13909 (8 July), 1.13771 (13 July),
1.13636 (23 July). Up a little, then down a little: the same floor. (The 28 July low of
1.13530 is not a swing yet: it needs two higher lows after it.)
For five weeks price went up and down inside about 158 pips (1.13243 to 1.14822) without
getting anywhere. The highs are not rising or falling, and neither are the lows. That is a
range.
Open each chart from the links above, one after another, on D1. For each one, mark the
swing highs and lows (lesson 3.1), then ask two questions:
Is each new swing high higher, lower, or about the same as the last one?
Is each new swing low higher, lower, or about the same as the last one?
Both higher: uptrend. Both lower: downtrend. Both about the same: range. Anything else
(say, higher highs but lower lows): no clear trend, so treat it as a range until the
swings agree.