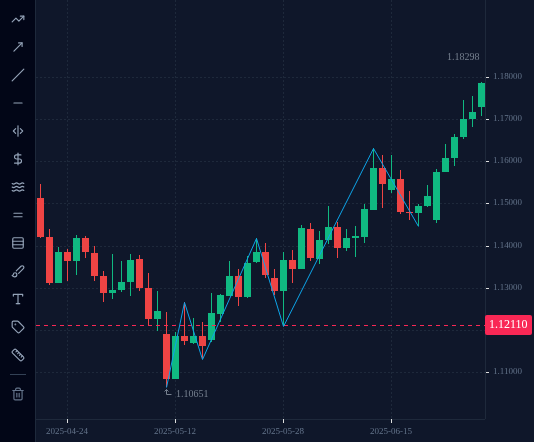
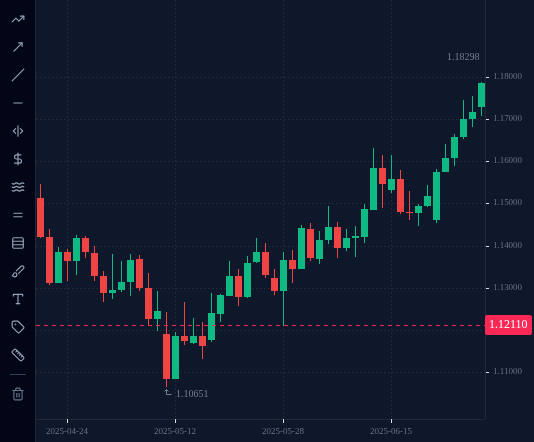
Price moves in waves. The peaks are swing highs and the dips are swing lows, and marking them is the first step to reading any trend.
In this lesson you learn to find the peaks and dips that every trend is made of, using one fixed
rule, on a real EURUSD chart from 2025.
1 Price moves in waves
Price never moves in a straight line. Even when it rises for weeks, it goes up, dips a
little, goes up again, dips again. Every wave leaves a peak and a dip behind it.
A swing high is a peak: a candle whose high sticks up above the candles around it.
A swing low is a dip: a candle whose low sticks down below the candles around it.
Swing highs and lows are the building blocks of this whole module. Trends, trendlines and
breaks of structure are all read from them.
2 The two-candle rule
“Sticks up above the candles around it” needs a fixed rule, or everyone marks different
points. A simple one:
Swing high: a candle whose high is higher than the highs of the two candles before
it and the two candles after it.
Swing low: a candle whose low is lower than the lows of the two candles before it and
the two candles after it.
Real example: EURUSD D1, May 2025.
Candle
High
Candle
Low
22 May
1.13448
27 May
1.13230
23 May
1.13754
28 May
1.12837
26 May
1.14185
29 May
1.12103
27 May
1.14071
30 May
1.13123
28 May
1.13454
2 June
1.13435
The 26 May high, 1.14185, is above the two highs on each side, so it is a swing high.
The 29 May low, 1.12103, is below the two lows on each side, so it is a swing low.
Quick check
3 Mark every swing on the chart
Apply the rule along EURUSD D1 from 12 May to 30 June 2025 and you get these swings, in order:
Date
Swing
Price
12 May
low
1.10651
14 May
high
1.12655
16 May
low
1.11308
26 May
high
1.14185
29 May
low
1.12103
5 June
high
1.14948
12 June
high
1.16311
19 June
low
1.14461
Two swing highs can come in a row (5 and 12 June): nothing between them dipped far enough
to count as a swing low. That is fine. The rule decides, not your eye.
The link below opens the chart with a line joining the swings, so you can see the waves.
The rule needs two candles after the swing. So you can only be sure the 26 May high was a
swing high once the 28 May candle had closed, two days later.
This matters most at the right-hand edge of the chart. On 30 June 2025 the highs had been
rising every day: 1.17449 (26 June), 1.17539 (27 June), 1.17881 (30 June). The newest high
is not a swing high yet, because no candles have formed after it. The last confirmed
swing high on that day was still 12 June, at 1.16311.
Marking the latest candle as a swing too early is one of the most common beginner mistakes.
Quick check
Question 3 · Click the chart
This is EURUSD D1 from 12 May to 30 June 2025. Click the last confirmed swing high, a high with two lower highs on each side of it.
EURUSD, D1, up to 2025-06-30 (UTC).
Tap or click the chart to pick a spot, then press Check. Keyboard: focus the chart, then arrow keys move the crosshair (Shift for bigger price steps), Enter picks.
Loading chart…
5 In the terminal: mark the swings yourself
Open EURUSD on D1 and scroll to 12 May to 30 June 2025. Use any drawing tool to mark each
swing high and swing low (a short horizontal line at each one works). Check every point
against the two-candle rule: two lower highs on each side of a swing high, two higher lows
on each side of a swing low.
Then compare your marks with the table in step 3. If you marked extra points, look again:
most often one of the neighbouring candles reached further.