Support and resistance trades lose too. Three real losing setups on EURUSD show the usual ways it goes wrong, a zone that finally breaks, a false break that takes your stop, and a trade from the middle of a range, plus the trap of drawing too many lines.
In this lesson you replay three real losing setups and the trap of too many lines, so you can
recognise them on your own chart. A loss with the stop in place is normal. A loss without one is
how accounts end.
1 Every level fails sometimes
Lessons 2.1 to 2.5 showed levels working. This lesson shows them failing, with real dates
and real prices, so you know what a loss looks like before it happens to you.
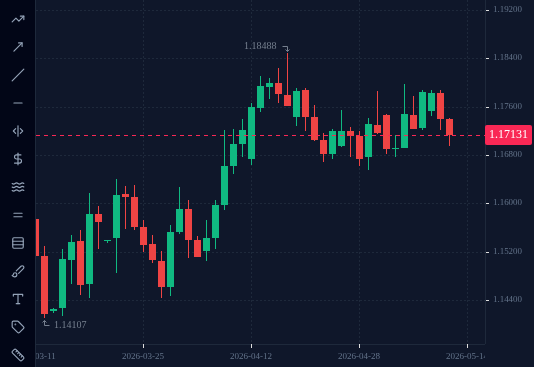
In the terminal: the link opens EURUSD on D1 in replay mode at 13 May 2026, the day
before setup 1 below filled, with the rest of the chart hidden. Draw the zone (1.1655 to
1.1680) and the stop (1.1640), then press Next bar one candle at a time up to 19 May.
Decide what you would have done before you see the next candle. Setups 2 and 3 are shown
as finished charts; their links open the dates they cite.
Every example uses 0.10 lot, so 1 pip = US$1.
EURUSD D1 in the practice terminal's replay mode, stopped at 13 May 2026, the day before the buy limit at 1.1680 filled; the candles after it are hidden.
Open this in the terminal
↗(opens in a new tab)
2 Failed setup 1: the zone that finally broke (May 2026)
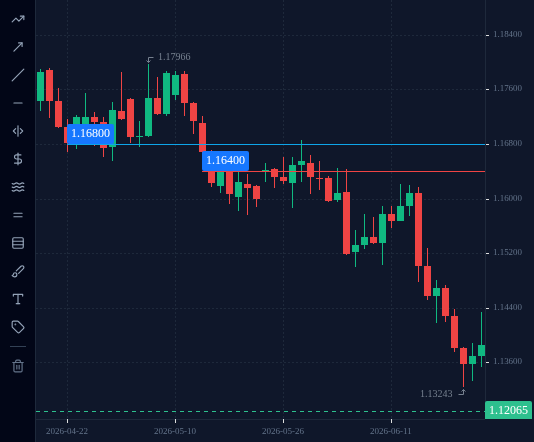
The same buy limit as lesson 2.5: entry 1.1680, stop-loss 1.1640, take-profit 1.1780. The
support zone 1.1655 to 1.1680 had stopped every fall since 23 April 2026.
14 May: the order filled. Price dipped as low as 1.16656 that day.
15 May: in the 05:00 UTC hour price fell to 1.16324 and hit the stop. Loss: 40 pips,
US$40, which was 1% of the US$4,000 account.
Afterwards: no daily close got back above 1.1660. By 24 June price was at 1.13243,
more than 350 pips below the entry.
This was not a mistake. The plan was followed and the stop did its job: it turned a fall of
more than 350 pips into a 40-pip loss. Zones break. That is why the stop is not optional.
EURUSD D1 chart from April to 26 June 2026 with the entry (1.1680, the top of the support zone) and the stop (1.1640): the zone broke on 15 May and price kept falling.
Open this in the terminal
↗(opens in a new tab)
3 Failed setup 2: the false break (October and November 2025)
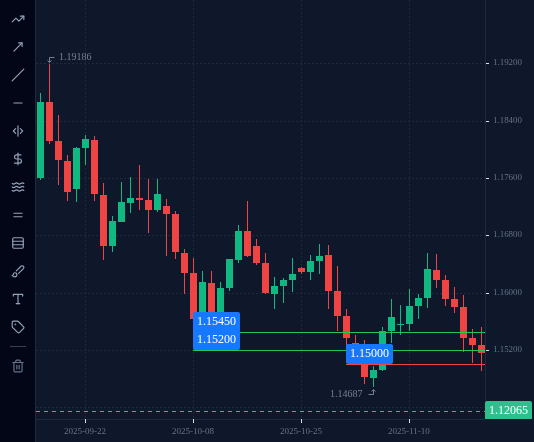
Support at about 1.1520 to 1.1545 had held on 9 October (low 1.15420), 14 October (1.15423)
and 31 October 2025 (1.15214). A trader placed a buy limit at 1.1545 with the stop at 1.1500,
the round number just below.
31 October: filled in the 13:00 UTC hour (low 1.15299).
4 November: in the 01:00 UTC hour price dipped to 1.14980 and hit the stop.
Loss: 45 pips, US$45.
5 November: the low was 1.14687. Then price turned.
6 November: an hourly candle closed back above 1.1545. On 13 November price reached
1.16559.
The level was broken for less than three days, then worked again. That is a false break. Stops
placed just past an obvious level, or on a round number, sit exactly where many other stops
sit, and price often reaches them before turning. A stop further beyond the zone, with a
smaller lot size so the risk stays at 1%, gives the trade more room. It still will not save
every trade.
EURUSD D1 chart from autumn 2025 to 21 November 2025 with the support zone (1.1520 to 1.1545) and the stop at 1.1500: price dipped below the stop on 4 and 5 November, then rose back through the zone.
Open this in the terminal
↗(opens in a new tab)
Quick check
4 Failed setup 3: buying in the middle of the range (April 2026)
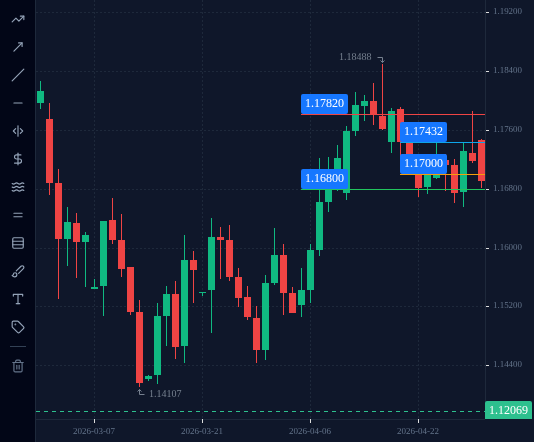
The range from lesson 2.2: support about 1.1655 to 1.1680, resistance about 1.1782 to 1.1797.
21 April 2026: a trader bought at the close, 1.17432, with a stop at 1.1700. That entry
was 88 pips above support and only 54 pips below resistance. There was no level under the
entry and no level behind the stop.
23 April: in the 00:00 UTC hour price fell to 1.16921 and hit the stop. Loss: 43 pips,
about US$43.
Later the same day price reached the real support, 1.16688, and from there rose to
1.17852 on 1 May.
The direction was not the problem. The location was. A trade in the middle of a range has
a stop with nothing behind it and a target with resistance close above.
EURUSD D1 chart up to 4 May 2026 with the inner edges of the range (top of support 1.1680, bottom of resistance 1.1782), the mid-range entry of 21 April (1.17432) and its stop (1.1700).
Open this in the terminal
↗(opens in a new tab)
Quick check
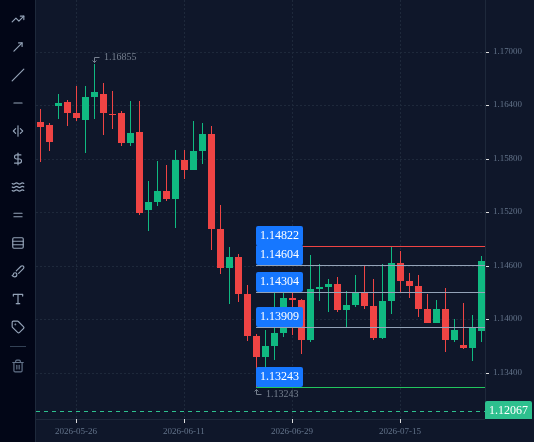
5 The trap of too many lines
From 24 June to 28 July 2026 EURUSD traded inside a box from 1.13243 (24 June low) to
1.14822 (15 July high), about 158 pips.
The two edges mattered: the bottom held seven times (lesson 2.1). But inside the box there
were smaller turns too, such as 1.13909 (8 July low), 1.14304 (29 June high) and 1.14604
(10 July high). Draw a line at every small turn like these and the lines end up only 20 to 40 pips apart. Then any
trade can be “at a level”, every stop has a line next to it, and the chart no longer tells
you anything.
Keep the zones with several touches on D1. Delete the rest.
EURUSD D1 chart of 24 June to 28 July 2026 with the box edges (1.13243 and 1.14822) and three lines at small turns inside it (1.13909, 1.14304, 1.14604): too many lines, too close together.
Open this in the terminal
↗(opens in a new tab)
Check your understanding
0 of 4 questions right. Answer them all to complete the lesson.