Some levels are visible to everyone without drawing a single line. Round numbers and the previous day's and week's highs and lows are where many traders place orders and alerts.
In this lesson you learn the levels you can find without drawing anything clever: round numbers
and previous highs and lows, and how to use a price alert so you are there when price arrives.
1 Round numbers
Prices such as 1.1500, 1.2000 or 160.00 are round numbers. People like them. When
traders choose where to put an order, a stop-loss or an alert, many pick a round number
instead of 1.14963. So orders pile up there, and price often reacts.
For EURUSD the big round numbers end in 00 (1.1500, 1.1600). For USDJPY they are whole yen
(159.00, 160.00), and every 50 pips in between (159.50) matters a little too.
2 Real example: USDJPY at 160.00
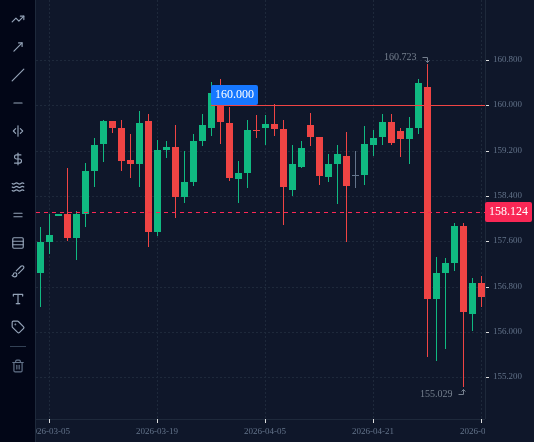
USDJPY D1, spring 2026. Price reached the 160.00 area five times in five weeks:
Trading day
High of the day
27 March 2026
160.414
30 March 2026
160.460
7 April 2026
160.029
29 April 2026
160.474
30 April 2026
160.723
Each time, price got above 160.00 but could not stay there. On 30 April it reached 160.723
and fell to 155.554 the same day, a drop of more than 500 pips (USDJPY pip = 0.01).
Notice two things. First, the highs went up to 72 pips past 160.00, so even a round number
is a zone. Second, it did not hold forever: in June 2026 price closed above 160.00 several
days in a row and the level stopped working as a ceiling.
USDJPY D1 chart from February to early May 2026 with a line at the round number 160.00, which capped the highs of 27 and 30 March, 7, 29 and 30 April.
Open this in the terminal
↗(opens in a new tab)
Quick check
Question 1 · Click the chart
On the USDJPY D1 chart from 18 March to 30 April 2026, price stalled at the same round number five times. Click that level.
USDJPY, D1, up to 2026-04-30 (UTC).
Tap or click the chart to pick a spot, then press Check. Keyboard: focus the chart, then arrow keys move the crosshair (Shift for bigger price steps), Enter picks.
Loading chart…
3 Previous day and week highs and lows
Yesterday’s high and low, and last week’s high and low, are levels every trader can find in
seconds. Many use them to place stops and to judge whether today is breaking out or staying
inside yesterday’s range.
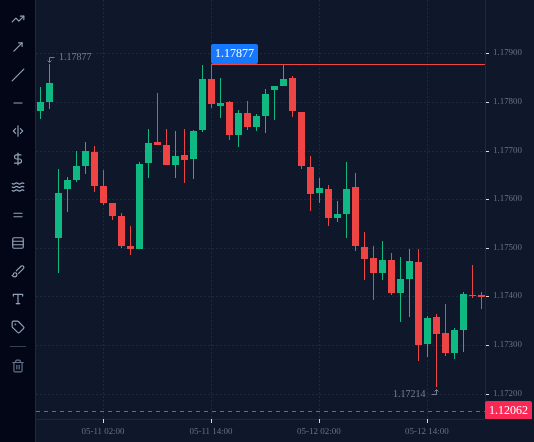
Real example, EURUSD: on 11 May 2026 the high of the day was 1.17877, made in the 14:00 UTC
hour. Shortly after the 12 May trading day began (the 22:00 UTC hour that evening), price rose
to 1.17875, less than a pip below the previous day’s high, and turned lower. The 12 May candle
closed at 1.17399. That high was also the top of the range
from lesson 2.2, so two reasons lined up in the same place.
In the terminal: open EURUSD on H1. Find yesterday’s candle on the D1 chart, read its high
and low, and draw a horizontal line at each on the H1 chart. Do the same for last week’s high
and low on W1 if you like. Label them so you know which is which.
Once you can find them by hand, let the terminal draw them: the link turns on Previous Day
High/Low and Previous Week High/Low (in the Indicators menu), which mark those levels
on every day of the chart.
You do not have to watch the chart all day waiting for a level. Set a price alert
a few pips before it, so you are told when price arrives.
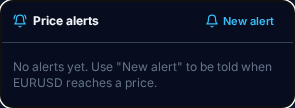
In the terminal (signed in; alerts belong to your account): in the price alerts panel press
New alert, choose Rises above or Falls below, type the level and press Create
alert. Set it a few pips before the nearest line you just drew, for example “Rises above”
5 pips below a previous-day high, or “Falls below” 5 pips above a previous-day low. The alert
fires once, then disarms, and you get an email (even with the tab closed) and, if the terminal
is open, a notice there. When it triggers, look at how price is behaving at the level before you decide
anything.
An alert is only a reminder. It does not open a trade.
A level gets more attention when several reasons point at the same area: a round number,
yesterday’s high, and a zone with several touches on D1, all within a few pips. The 12 May
2026 example had two of these together.
A level with only one reason, such as a random hourly swing in the middle of a range, is much
less likely to matter. When you have more lines than you can explain, delete the ones with
only one reason.
Check your understanding
0 of 3 questions right. Answer them all to complete the lesson.