When price breaks through a level, the level often swaps jobs. Broken resistance can act as support on the way back down, and broken support can act as resistance on the way back up.
In this lesson you learn role reversal: why a broken level often matters again from the other
side, and how to find the likely retest before it happens.
1 A level can swap jobs
When price finally breaks through a level, the level does not disappear. It often swaps
roles:
Broken resistance becomes support. After price closes above it, a fall back to that
area often meets buyers.
Broken support becomes resistance. After price closes below it, a rise back to that
area often meets sellers.
Why? Think about who is there. Traders who sold at resistance and watched price break
higher are losing. Many will buy back if price returns to where they sold, just to get out
at break-even. Traders who missed the breakout wait for a second chance at the old level.
Both groups put buying pressure in the same place. The same logic runs in reverse when
support breaks.
The return to the broken level is called a retest.
Quick check
2 Real example: resistance becomes support
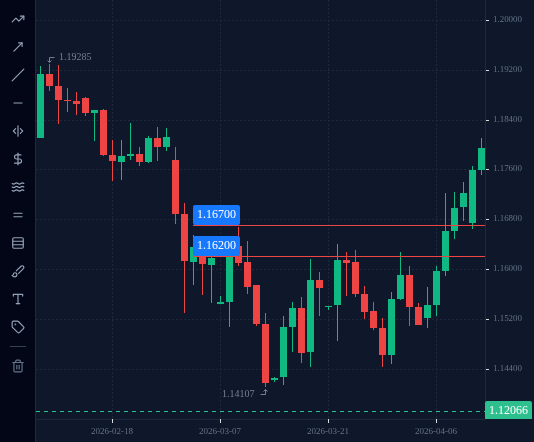
EURUSD D1, spring 2026.
The resistance. From 4 March to 7 April 2026, rallies kept stopping between about
1.1620 and 1.1670. Highs included 1.16545 (4 March), 1.16670 (10 March), 1.16396
(23 March) and 1.16270 (1 April).
The break. On 9 April price closed above the zone at 1.16974, and on 10 April at 1.17216.
The retest. On Monday 13 April price dipped back to 1.16639, inside the old resistance
zone, and closed the day at 1.17586. The next day it reached 1.18110.
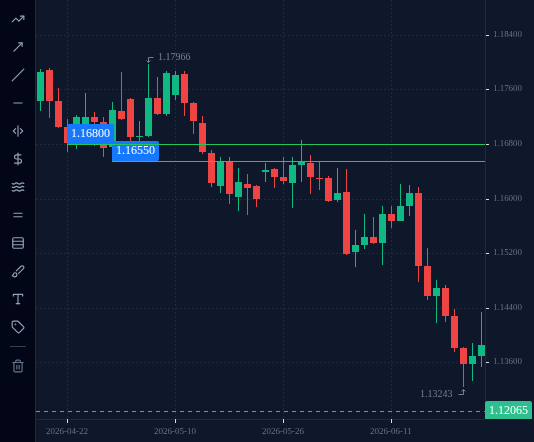
EURUSD D1, May and June 2026. This is the same support zone you drew in lesson 2.2.
The support. From 23 April to 14 May 2026 the zone between about 1.1655 and 1.1680
stopped every fall.
The break. On 15 May price fell through it and closed at 1.16234.
The retest. For the next two weeks rallies kept stalling just under the old support.
The highs on 18, 19, 27 and 28 May were 1.16605, 1.16614, 1.16614 and 1.16611. On 29 May
price poked up to 1.16855, inside the old zone, and on 1 June it stopped at 1.16645.
What came next. Price fell away from the zone. By 24 June it had reached 1.13243.
The old floor had become a ceiling.
EURUSD D1 chart from April to 26 June 2026 with the old support zone, 1.1655 to 1.1680, marked by two lines: broken on 15 May, then retested from below.
Open this in the terminal
↗(opens in a new tab)
Quick check
Question 3 · Click the chart
On EURUSD D1, the support zone that held from 23 April to 14 May 2026 broke on 15 May. Click where a retest from below was most likely in the following weeks.
EURUSD, D1, up to 2026-06-01 (UTC).
Tap or click the chart to pick a spot, then press Check. Keyboard: focus the chart, then arrow keys move the crosshair (Shift for bigger price steps), Enter picks.
Loading chart…
4 Replay a break and a retest
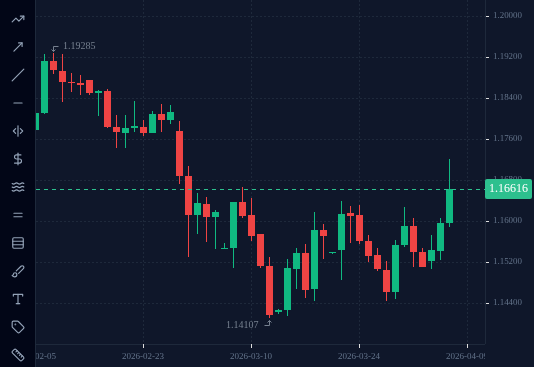
In the terminal: the link opens EURUSD on D1 in replay mode, stopped at 8 April 2026 with
everything after it hidden. First draw the old resistance zone (about 1.1620 to 1.1670) with the
Horizontal line or Rectangle tool. Then press Next bar to reveal one candle at a time up to
14 April, and watch what price does when it comes back to the zone. Replay works signed out,
and any trade you place in it is simulated, never on your practice account.
Replay is useful because you cannot see the right side of the chart. You have to decide
where the retest might come before it happens, which is exactly the situation you face in
live trading.
EURUSD D1 in the practice terminal's replay mode, stopped at 8 April 2026: the chart ends at that candle, before the break above the 1.1620 to 1.1670 resistance.
Open this in the terminal
↗(opens in a new tab)
5 A retest is a place to watch, not a promise
Role reversal tells you where to pay attention. It does not tell you what will happen.
Sometimes price never comes back to the level at all.
Sometimes it comes back and goes straight through. Then the break was false, which is one
of the failures in lesson 2.6.
The retest is a zone, like every level. Most retest highs in May 2026 stopped near
1.1661, but on 29 May price reached 1.16855, well inside the old zone, before turning.
Treat the retest area as a place where a trade might make sense, then use the rules in
lesson 2.5 to decide.
0 of 3 questions right. Answer them all to complete the lesson.