Price remembers where it turned before. Support is an area below price where falls have stopped, resistance is an area above where rises have stopped, and both are zones, not exact lines.
In this lesson you learn what support and resistance are, why old turning points matter again,
and why a level is a zone rather than a line. Next lesson: how to draw them properly.
1 Price has a memory
Look at any chart for long enough and you will see price turn at the same places again
and again.
Support is an area below the current price where falls have stopped before.
Buyers stepped in there.
Resistance is an area above the current price where rises have stopped before.
Sellers stepped in there.
Why would a price matter twice? Because people remember it. A trader who missed buying at a
low waits for price to come back. A trader who bought at a high and watched it fall is happy
to sell when price returns to where they got in. Many traders also leave orders and alerts
at prices they can see on the chart. All of that turns old turning points into places
where something tends to happen again.
Quick check
2 Levels are zones, not exact lines
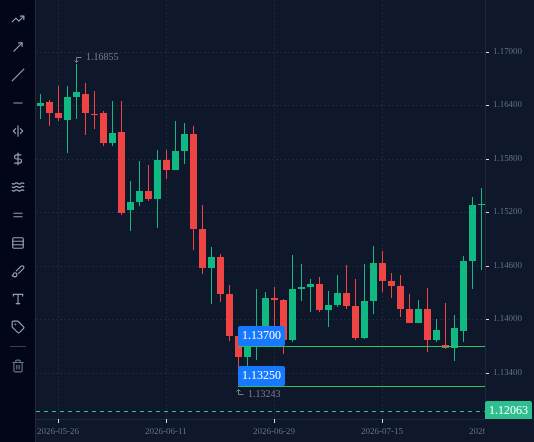
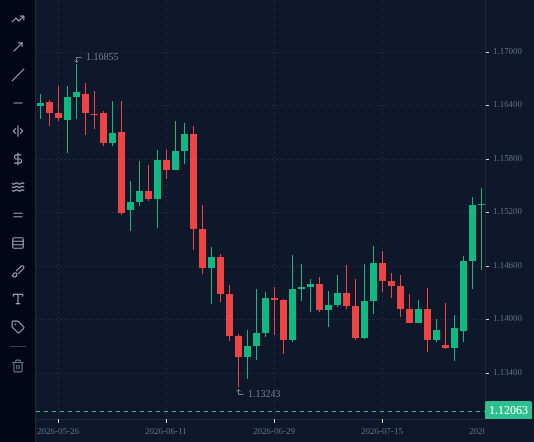
Here is a real example. On the EURUSD daily (D1) chart, between 24 June and 28 July 2026,
price fell to the same area seven times:
Trading day
Low of the day
24 June 2026
1.13243
25 June 2026
1.13331
26 June 2026
1.13540
1 July 2026
1.13615
23 July 2026
1.13636
27 July 2026
1.13666
28 July 2026
1.13530
The lows are not the same price. The deepest is 1.13243 and the shallowest is 1.13666,
about 42 pips apart. That is normal. Support is a zone, here roughly 1.1325 to 1.1370,
not a single price you can draw to the pip.
From 29 to 31 July 2026 price rose away from that zone to 1.15472.
On the EURUSD D1 chart from 22 June to 31 July 2026, click the strongest support zone, the area price fell to most often before it rose at the end of July.
EURUSD, D1, up to 2026-07-31 (UTC).
Tap or click the chart to pick a spot, then press Check. Keyboard: focus the chart, then arrow keys move the crosshair (Shift for bigger price steps), Enter picks.
Loading chart…
3 Zoom out to the daily chart first
On a 15-minute chart you will find a “level” every few candles. Most of them do not matter.
Levels on the daily chart are the ones the most traders can see, so start there.
In the terminal: open the EURUSD chart, switch the timeframe to D1, and scroll back to June
and July 2026. Pick the horizontal line tool and place one line through the cluster of lows
in the table above. You will see that no single line touches every low exactly. Some wicks
poke below it, some stop short. That is the zone at work.