Leverage lets a small deposit open a large position. It does not change how much a pip is worth, so high leverage plus a big size and no stop can end an account in one move.
In this lesson you see how leverage and margin work, what margin level and a margin call are, and
how a real move on USDJPY would have ended an over-leveraged account with no stop.
1 What leverage and margin are
To open a position, your broker sets aside part of your money as margin. Leverage is how
big a position each dollar of margin can open.
At 1:500 leverage, $1 of margin opens $500 of position. Example on USDJPY, where the base is the
US dollar: 1.00 lot is 100,000 US dollars, so the margin is $100,000 ÷ 500 = $200.
Here is the trap: leverage changes how much margin is set aside. It does not change how much
each pip is worth. A $1,000 account at 1:500 can open a 1.00 lot position, and every pip on it
moves the account exactly as much as it would on a 1.00 lot USDJPY position at any other
leverage.
Quick check
2 Margin level and margin calls
Your account panel shows margin level:
Margin level = equity ÷ used margin × 100%
Example: equity $1,000, used margin $200 gives a margin level of 500%. If the trade loses $700,
equity is $300 and margin level is $300 ÷ $200 × 100% = 150%.
As losses grow, margin level falls. At a level your broker sets, you get a margin call (a
warning, and you may not be able to open new trades). At a lower level, the stop-out, the
broker closes your positions for you. The exact levels depend on the broker and account; check
them in your account’s terms.
A stop-out is not a safety net. It closes your trade after most of the money is already gone.
Quick check
3 A real move, no stop, 1:500
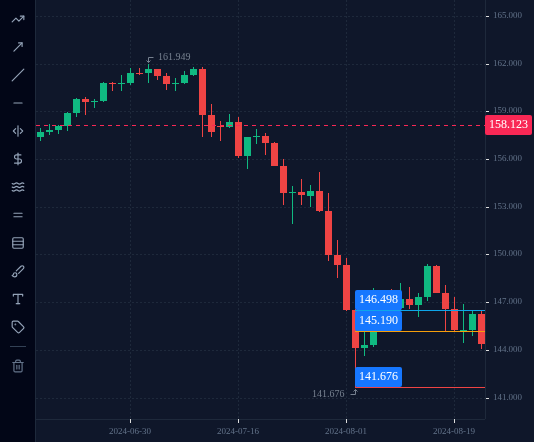
On Monday 5 August 2024, USDJPY opened its daily candle at 146.498 and traded as low as 141.676
the same day. That is a fall of 4.822 yen, or 482 pips.
Imagine a $1,000 account that had bought 1.00 lot at the open, with no stop, at 1:500.
Loss at the low: 100,000 × 4.822 = 482,200 yen. At 141.676 yen per dollar that is about
US$3,404, more than three times the account.
Suppose the broker’s stop-out were at 50% margin level. With $200 margin, that happens when
equity falls to $100, a loss of $900. That is reached near 145.19, only about 131 pips
below the entry, long before the low.
With the lesson 1.4 method instead: 1% risk is $10. A stop 131 pips away would need a tiny size,
around 0.01 lot ($10 ÷ (131 pips × about $6.83 a pip per lot) ≈ 0.011, rounded down).
Hitting that stop the same day would have cost about $9.
USDJPY D1 chart around 5 August 2024, with lines at that day's open (146.498), the example stop-out level (near 145.19) and the day's low (141.676).
Open this in the terminal
↗(opens in a new tab)
Quick check
4 Daily loss limits
Bad days happen, and after a few losses many traders start forcing trades to win it back. A
daily loss limit is a rule you set in advance: once you have lost a set amount in one day,
you stop trading until the next day.
Example: with 1% risk per trade, a limit of 3% means three full losses and you are done for the
day. The number is yours to choose; what matters is choosing it before the day starts.
5 Watch it in a replay
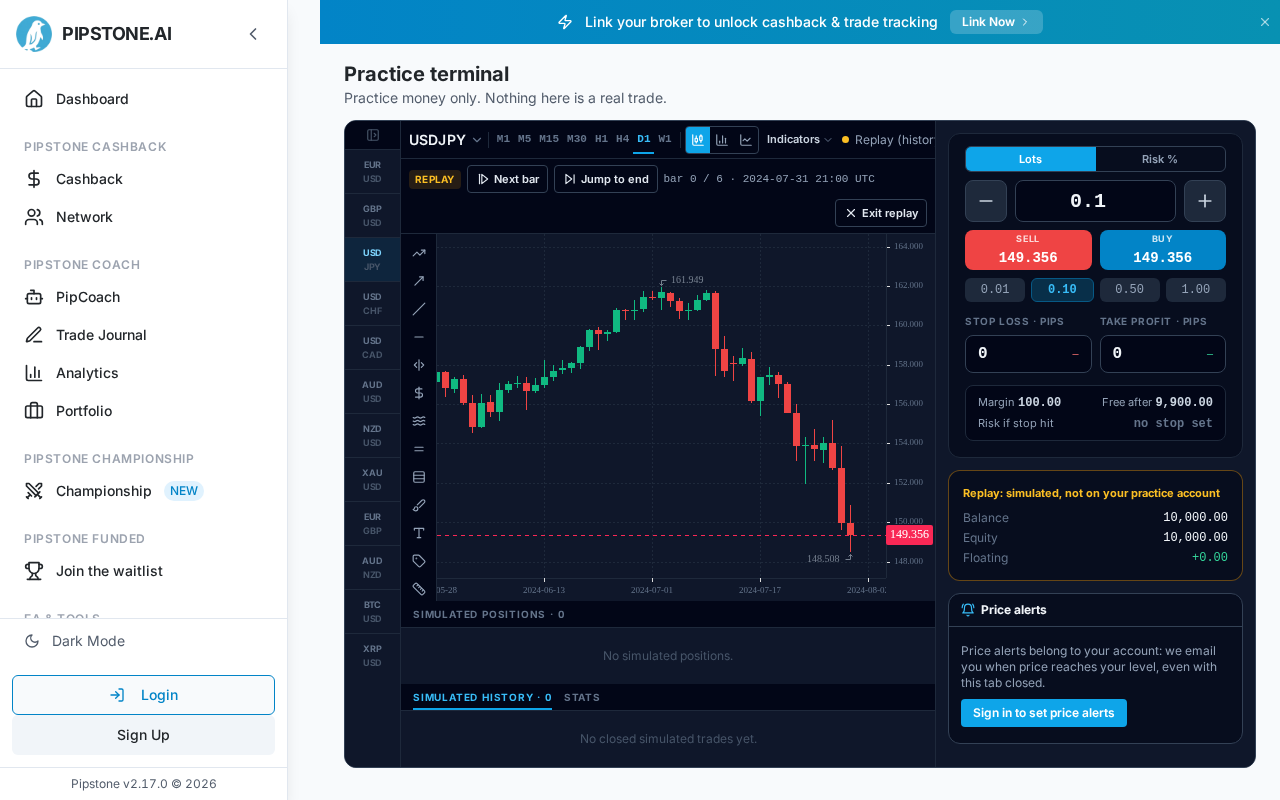
The link opens USDJPY on the D1 chart in replay mode: the chart stops at the 1 August 2024
candle (the terminal labels it 31 July 21:00 UTC, when that trading day opens) and hides
everything after it, and you reveal one candle at a time with Next bar until
9 August. Replay works signed out. Its trades are simulated on a separate replay account
(10,000, leverage 1:100, labelled “Replay: simulated, not on your practice account”), so
nothing you do here touches your practice account.
Place a large buy at the start with no stop, and keep the replay account (Balance, Equity,
Floating) in view. An order fills at the open of the next candle. Step forward one candle at a
time and watch equity fall as the yen surges on 5 August.
Then open the link again to start over, place a correctly sized buy with a stop (the ticket’s
Risk % mode sizes it for you), and compare where the account ends.
The practice terminal in replay mode on USDJPY D1, stopped at the 1 August 2024 candle (bar 0 of 6): the REPLAY controls (Next bar, Jump to end, Exit replay) above the chart, and the order ticket and simulated replay account (balance 10,000) beside it.
Open this in the terminal
↗(opens in a new tab)
Practice mission
White belt mission
5 practice trades, every one with a stop-loss and no more than 1% risk.
A closed practice trade counts when it had a stop-loss from the moment it opened and risked no more than 1% of the account balance at that moment. Graded symbols: EURUSD, GBPUSD, AUDUSD, NZDUSD, XAUUSD.
Loading…
0 of 4 questions right. Answer them all to complete the lesson.