Risk-to-reward compares what a trade can lose with what it aims to make. Together with your win rate it decides whether a run of trades makes or loses money.
In this lesson you measure risk and reward on a real EURUSD trade, see how win rate and R:R work
together, and work out the win rate where a run of trades breaks even.
1 What 1:2 means
Risk is the distance from your entry to your stop. Reward is the distance from your entry
to your take-profit. The risk-to-reward ratio (R:R) compares them.
At 1:2, the target is twice as far from the entry as the stop. If you risk $10, the target
makes $20.
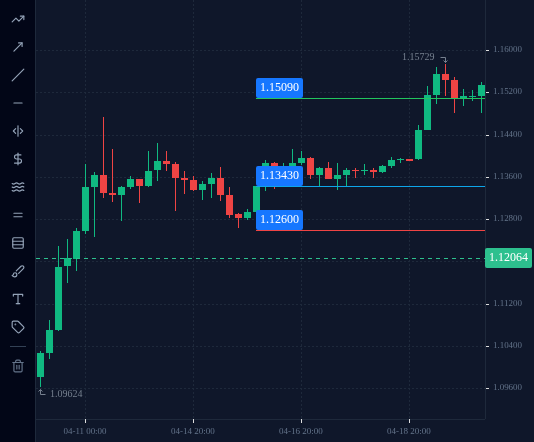
A real example on EURUSD H4: on 16 April 2025 the 00:00 UTC candle closed at 1.1343. A buyer
with a stop at 1.1260 (just under the 15 April low from lesson 1.2) risks
1.1343 − 1.1260 = 0.0083, which is 83 pips. A 1:2 target is 2 × 83 = 166 pips above the
entry: 1.1343 + 0.0166 = 1.1509.
EURUSD H4 chart in April 2025, with the entry (1.1343, the 16 April 00:00 UTC close), the stop (1.1260, 83 pips below) and the 1:2 target (1.1509, 166 pips above).
Open this in the terminal
↗(opens in a new tab)
Quick check
2 Win rate and R:R work together
Your win rate is the share of trades that reach the target. Neither number means much alone.
Ten trades, each risking $10, at 1:2 (each win makes $20):
4 wins and 6 losses: +$80 − $60 = +$20
3 wins and 7 losses: +$60 − $70 = −$10
At 1:1 (each win makes $10), 4 wins and 6 losses is +$40 − $60 = −$20.
A higher R:R lets you be wrong more often. But a target further away has more distance to
cover, so it is usually reached less often. There is no free lunch; the two numbers trade off.
These sums ignore costs, and they say nothing about what win rate any method will actually get.
3 The break-even win rate
The break-even win rate is the win rate where wins and losses cancel out.
Break-even win rate = 1 ÷ (1 + R), where R is the reward for each 1 of risk.
1:1 → 1 ÷ 2 = 50%
1:2 → 1 ÷ 3 = 33.3%
1:3 → 1 ÷ 4 = 25%
Check for 1:2: out of 3 trades, 1 win (+2) and 2 losses (−1, −1) adds up to 0.
These figures ignore costs. Spread, commission and overnight swap make every trade a little
worse, so the real break-even win rate is somewhat higher.
Quick check
4 Measure it on the chart
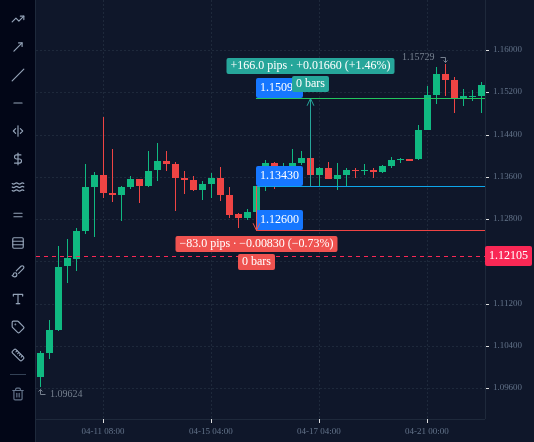
Open EURUSD on the H4 chart in the practice terminal and go to 16 April 2025. Pick Measure
on the chart’s drawing rail and drag from the entry to the stop, then from the entry to the
target. The tool shows each distance in pips. You can also read the prices and subtract.
The picture shows both measurements: entry 1.1343 to stop 1.1260 is 83 pips of risk, entry
1.1343 to target 1.1509 is 166 pips of reward.
Divide reward by risk: 166 ÷ 83 = 2, a 1:2 trade. If the answer is below 1, the trade risks
more than it aims to make.
Chart prices are bid prices. These examples ignore the spread you pay when you buy.
EURUSD H4 chart in the practice terminal, April 2025: entry line 1.1343, stop line 1.1260 and target line 1.1509, with the Measure tool from the entry down to the stop and from the entry up to the target.
Open this in the terminal
↗(opens in a new tab)
Check your understanding
Question 3 · Click the chart
On 16 April 2025 a buyer enters EURUSD at 1.1343 (the close of the 00:00 UTC H4 candle) with a stop at 1.1260 and a 1:2 target at 1.1509. Click the point on the chart where price first reached the 1.1509 target.
EURUSD, H4, up to 2025-04-21 (UTC).
Tap or click the chart to pick a spot, then press Check. Keyboard: focus the chart, then arrow keys move the crosshair (Shift for bigger price steps), Enter picks.
Loading chart…
0 of 3 questions right. Answer them all to complete the lesson.