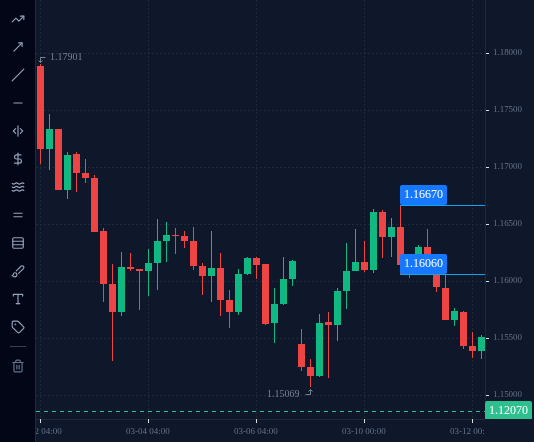
A chart shows how the price moved over time. Each candle packs four prices into one shape, and the timeframe decides how much time one candle covers.
In this lesson you learn to read a candlestick, how it differs from a line chart, and what
changing the timeframe does to the picture.
1 Line chart and candlestick chart
A line chart joins up one price per period, usually the closing price. It is clean and
shows the general direction, but it hides everything that happened inside each period.
A candlestick chart draws one candle per period, and each candle shows four prices:
Open: the first price of the period.
High: the highest price reached.
Low: the lowest price reached.
Close: the last price of the period.
Most traders use candles because they show how far the price travelled, not just where it
ended.
2 Reading one candle
The thick part is the body: it runs from the open to the close. The thin lines above
and below are the wicks (or shadows): they reach up to the high and down to the low.
If the close is above the open, the price rose during that period (an up candle). If the
close is below the open, it fell (a down candle). Platforms colour the two differently,
often green or white for up and red or black for down.
A real candle: EURUSD, 4-hour chart, 10 March 2026, the candle that opened at 16:00 UTC
(Pipstone price feed). Open 1.16472, high 1.16670, low 1.16060, close 1.16141.
Close below open, so it is a down candle. It closed (1.16472 − 1.16141) ÷ 0.0001 =
33.1 pips lower than it opened.
From low to high it covered (1.16670 − 1.16060) ÷ 0.0001 = 61 pips.
A long wick shows the price went somewhere and was pushed back before the candle closed.
This is EURUSD on the 4-hour chart for 10 March 2026. Click the candle with the highest high of the day.
EURUSD, H4, up to 2026-03-10 (UTC).
Tap or click the chart to pick a spot, then press Check. Keyboard: focus the chart, then arrow keys move the crosshair (Shift for bigger price steps), Enter picks.
Loading chart…
3 Timeframes
The timeframe is how much time one candle covers:
M5: 5 minutes, so 12 candles per hour.
M15: 15 minutes. H1: 1 hour. H4: 4 hours, so 6 candles per day.
D1: one day. W1: one week.
The same market looks very different on different timeframes. One D1 candle holds all the
M5 candles of that day. A move that looks huge on M5 may be a small wick on D1.
Times on a chart are in the platform’s time zone. This course gives times in UTC; check
which zone your chart uses before matching a candle to a time.
Quick check
4 In the terminal: switch chart type and timeframe
Open an EURUSD chart in the practice terminal on the M5 timeframe. Switch the chart type
between line and candles and compare what each one shows.
Then step through the timeframes from M5 to M15, H1, H4 and D1. Watch how each candle gets
bigger and how fewer candles fit on the screen. Hover over a candle to read its open, high,
low and close.