A pip is the standard unit for measuring a price move. Its size depends on the symbol, and the extra decimal on most quotes is a point, a tenth of a pip.
In this lesson you learn how to measure a price move in pips, why yen pairs and gold use a
different pip size, and how not to confuse a pip with a point.
1 What a pip is
A pip is the unit traders use to measure how far a price moved. Saying “EUR/USD rose
65 pips” is easier than saying “it rose 0.0065”.
For most pairs a pip is the fourth decimal place: 0.0001.
Most platforms show one more decimal than the pip: five decimals on EUR/USD (1.16103),
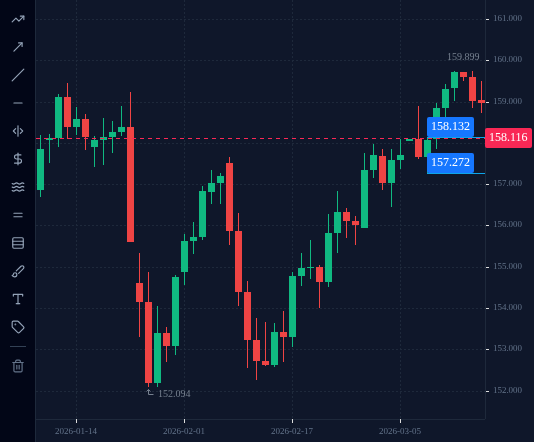
three on USD/JPY (158.078). That last digit is a point, also called a pipette. One point
is a tenth of a pip.
EUR/USD: 1 pip = 0.0001, 1 point = 0.00001.
USD/JPY: 1 pip = 0.01, 1 point = 0.001.
Watch out: some platforms count moves in points, not pips. A “15” in points is only
1.5 pips. Always check which unit a number is in.
Quick check
4 Gold uses its own convention
Gold (XAUUSD) is priced in US dollars per ounce, and brokers do not all agree on what a pip
is. In this course, one pip on gold is 0.10 (ten cents), and one point is 0.01. Check the
contract details of your own account before relying on that.
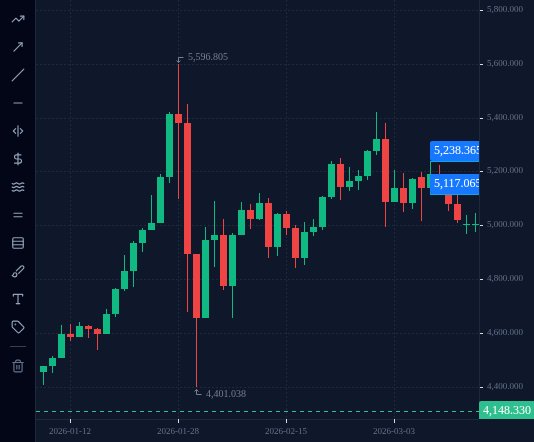
A real example: on 10 March 2026 (XAUUSD, daily chart, Pipstone price feed) gold traded
between 5,117.065 and 5,238.365. That is a range of 121.30 dollars, or
121.30 ÷ 0.10 = 1,213 pips in one day. Gold can move a long way in pips, so what each pip is worth in
money (lesson 0.4) matters a lot on it.
5 In the terminal: read a quote and measure a move
Open the practice terminal with an EURUSD chart. Read the current bid and say out loud which
digit is the pip and which is the point.
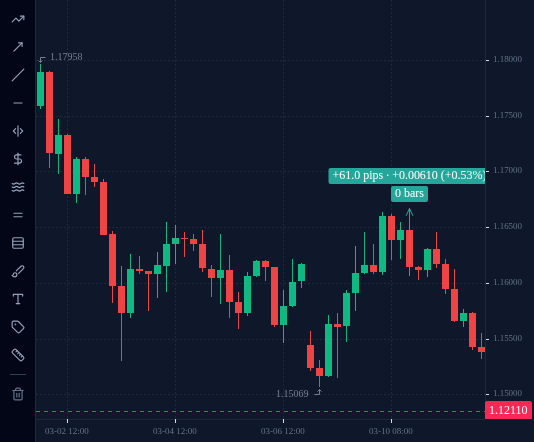
Then pick Measure on the chart’s drawing rail and drag from the low of one candle to the
high of a later one. The tool shows the distance in pips, the price difference, the percentage
and the number of bars. Work out the same distance yourself in pips with the rule above and
check that both answers agree. If they differ by a factor of ten, one of them is counting in
points.
The picture measures one EURUSD H4 candle, 10 March 2026 at 16:00 UTC: low 1.16060, high
1.16670. 1.16670 − 1.16060 = 0.00610, which is 61.0 pips, or 610 points. The link opens the
same chart with the same measurement, so you can check it and then draw your own.
EURUSD H4 chart in the practice terminal, 10 March 2026: the Measure tool drawn from the 16:00 UTC candle's low (1.16060) to its high (1.16670), showing the distance in pips.
Open this in the terminal
↗(opens in a new tab)
0 of 3 questions right. Answer them all to complete the lesson.